On this page
Subscribe to receive the latest blog posts to your inbox every week.
By subscribing you agree to with our Privacy Policy.
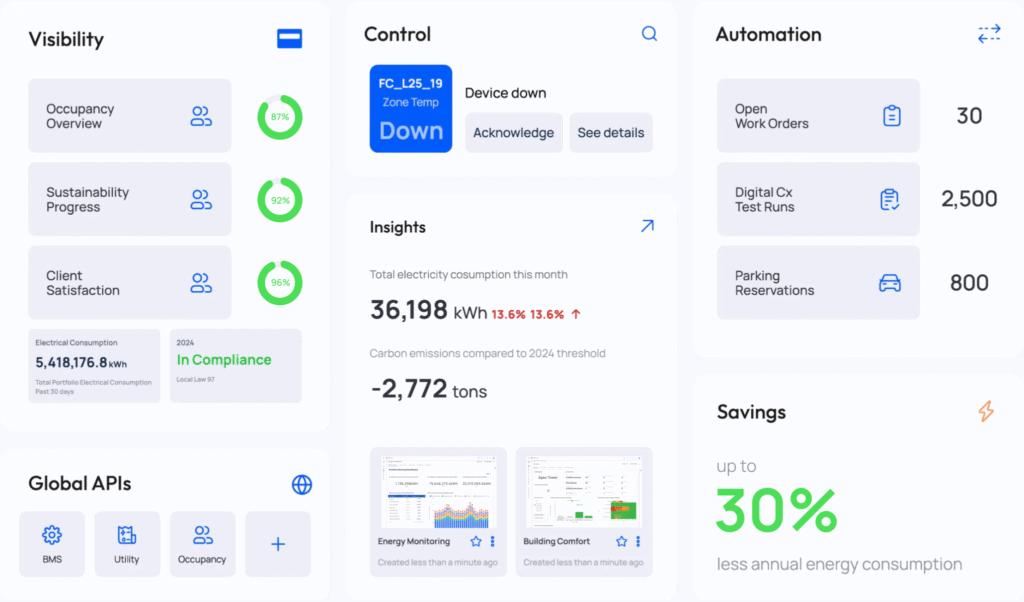
Building BI: Energy Insights consolidates key energy metrics across entire portfolios, providing advanced analytics to monitor and optimize energy use. Here’s what it measures:
Building BI enables CRE Executives to:
Managing energy data for large portfolios can feel overwhelming, especially when tracking multiple metrics across multiple buildings, in different locations.
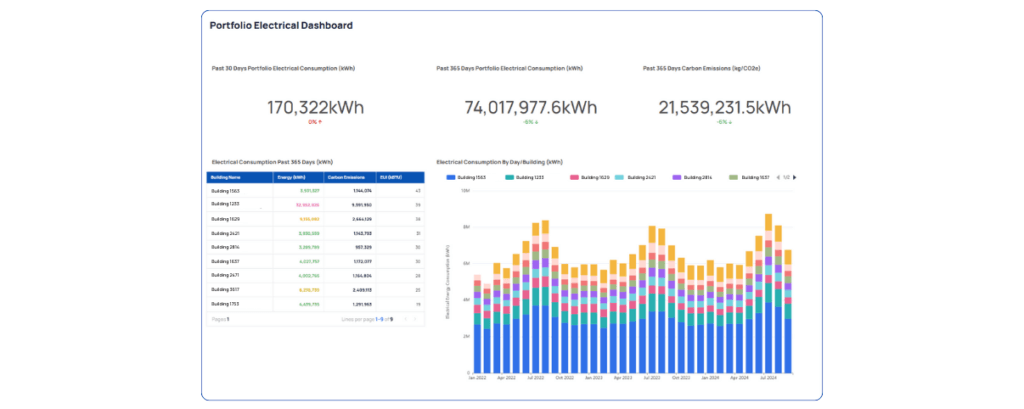
With Building BI optimized for energy insights, users get a clear snapshot of their energy landscape. For example, one client with over 50 buildings in their portfolio uses the Portfolio Electrical Consumption view to identify high-energy buildings and optimize their performance. This actionable insight helps them reduce unnecessary consumption while ensuring compliance with local regulations like New York’s Local Law 97.
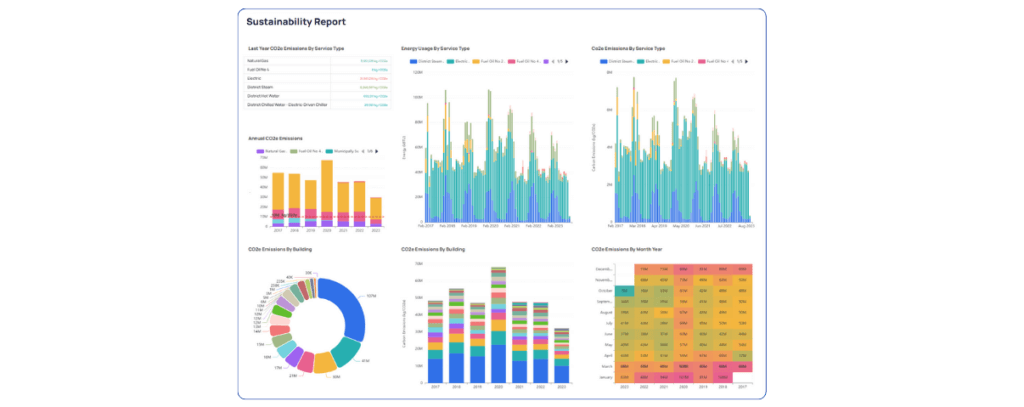
Building BI simplifies ESG reporting by tracking CO2e emissions across buildings and services. Users can monitor their carbon footprint, support certifications, and align with sustainability goals, all while streamlining reporting and demonstrating measurable progress.
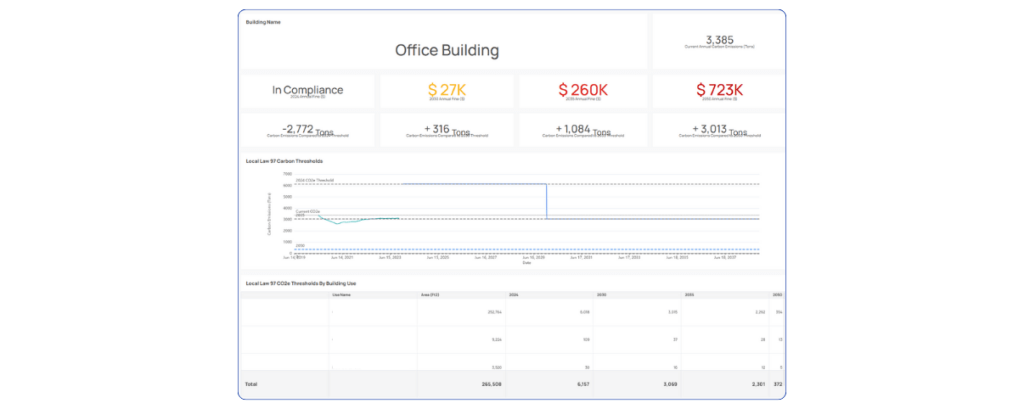
Staying ahead of evolving sustainability regulations is critical for modern portfolios. Building BI includes a Local Law 97 Calculator, which shows how compliant your portfolio is and calculates potential fines for non-compliance. Users can address these gaps proactively, ensuring their operations align with sustainability standards.
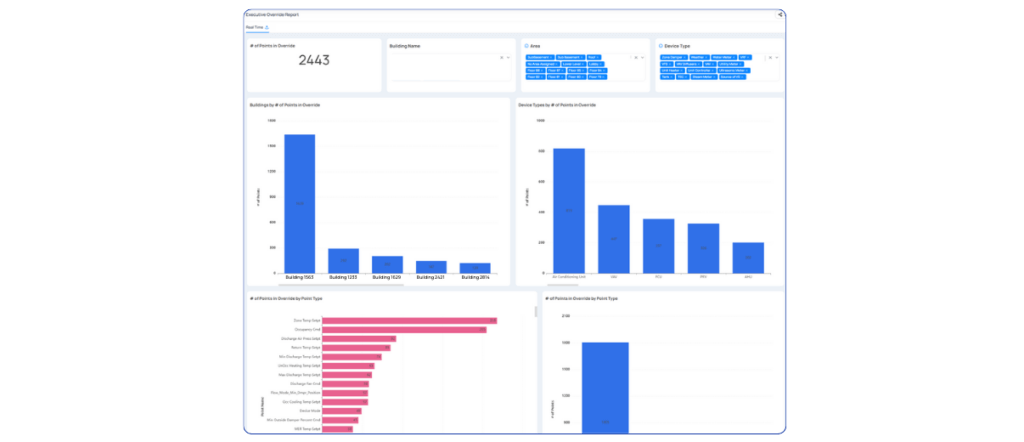
Building BI identifies points left on override across the portfolio, allowing users to quickly address forgotten settings and unnecessary energy use. This feature helps uncover hidden savings opportunities, ensuring energy efficiency and operational optimization.
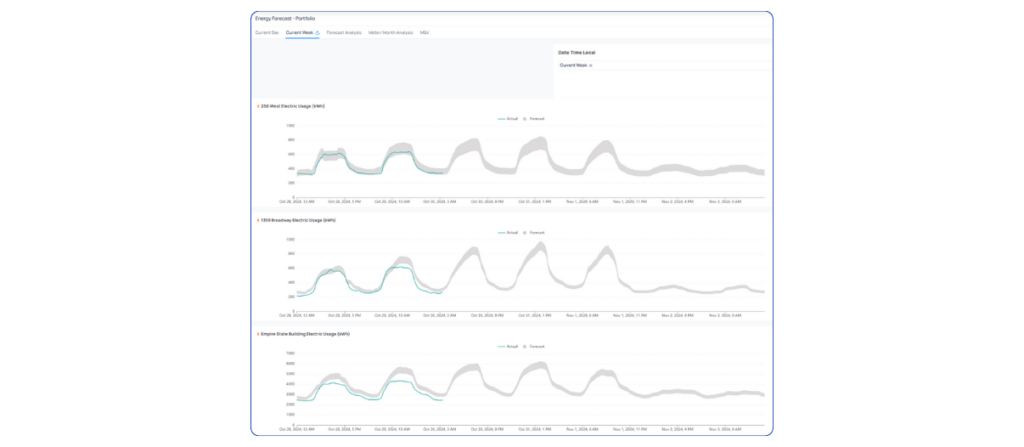
Building BI provides detailed energy usage forecasts, helping clients anticipate future needs, set accurate budgets, and align with sustainability targets. With insights tailored to the entire portfolio, CRE Executives can make proactive, data-driven decisions.
Data visualization is a game-changer. With pre-built dashboards and a robust library, Building BI allows users to create tailored views for different roles. Whether tracking energy forecasts or monitoring override points, clients can quickly make data-driven decisions.
By consolidating all these insights in one place, Building BI empowers users to manage energy, sustainability, and compliance with confidence and efficiency. As someone who works closely with global portfolios, I’ve seen how this feature drives results, whether it’s reducing carbon footprints, saving on energy costs, or achieving sustainability certifications.
If you want to learn more about how Building BI can impact your operations and bottom line, let’s connect on LinkedIn or book a demo with our team.
Art Gjyshinca
Account Executive, KODE Labs
News, insights and resources from the world of smart building management.
By clicking "Sign Up" you're confirming that you agree with our Terms and Conditions.

Most employees don’t think about indoor air quality until something feels wrong. A meeting room is too warm, the air…
Read more

What does the Functional Testing Tool do? For building integrators, functional testing becomes difficult at scale. Testing one fan coil…
Read more
Originally published on Facility Executive The next phase of facility management relies on unified data streams to optimize building performance,…
Read more