Cloud command and control
Cloud BMS enables building managers to monitor and control building systems like HVAC, lighting, and more from a centralized platform.
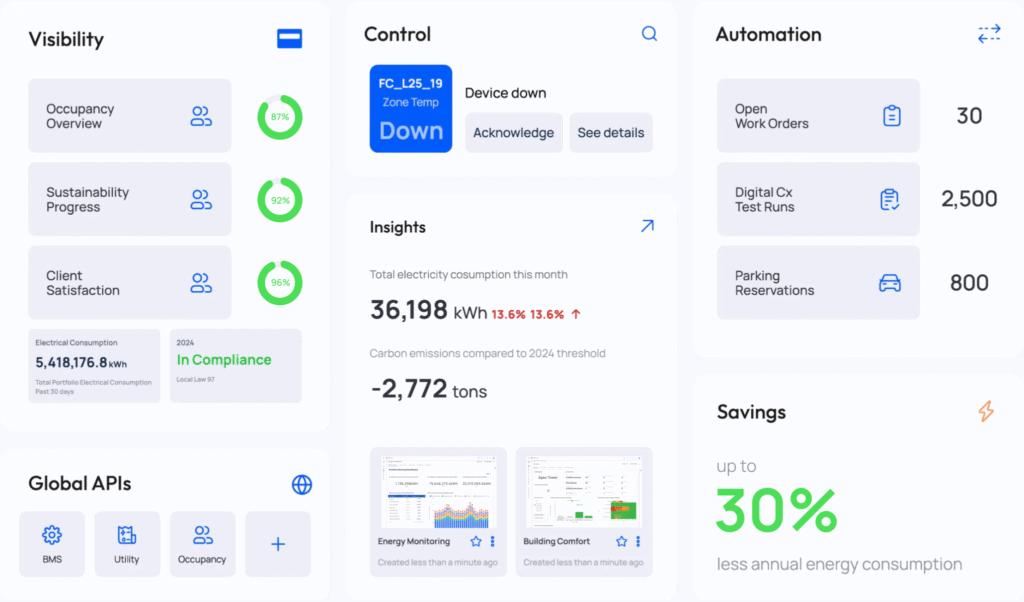
Cloud BMSKODE OS gives you an all-encompassing platform that transforms your building operations.


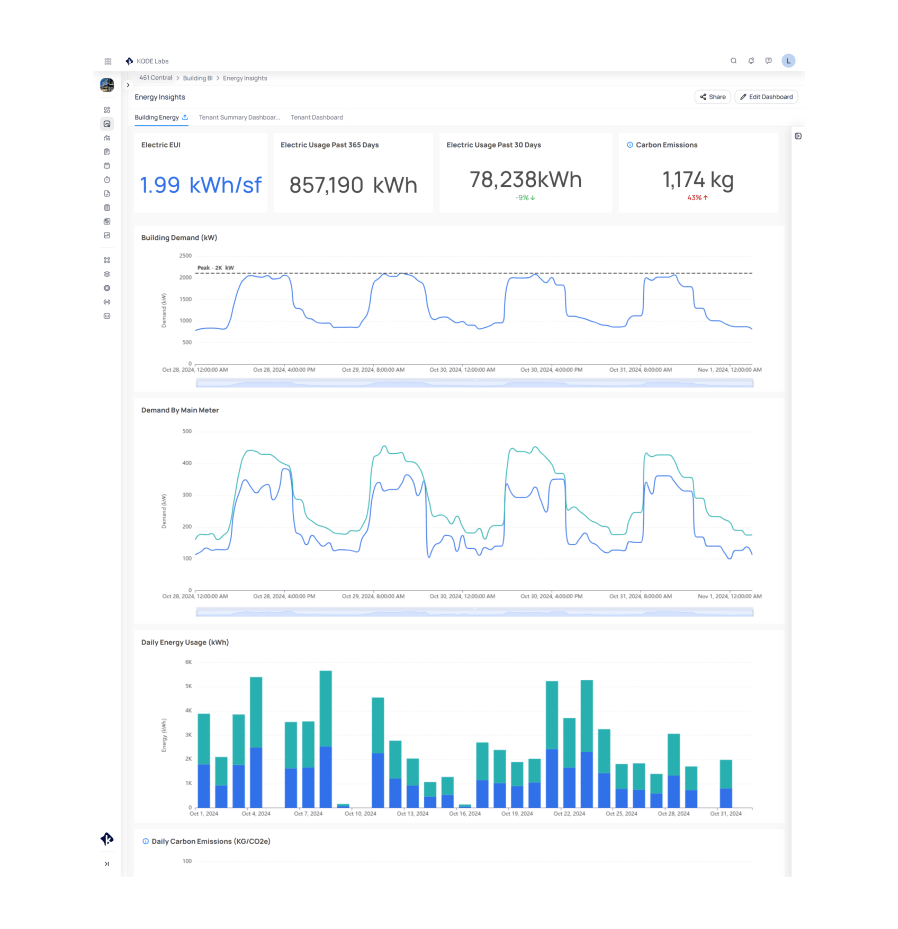
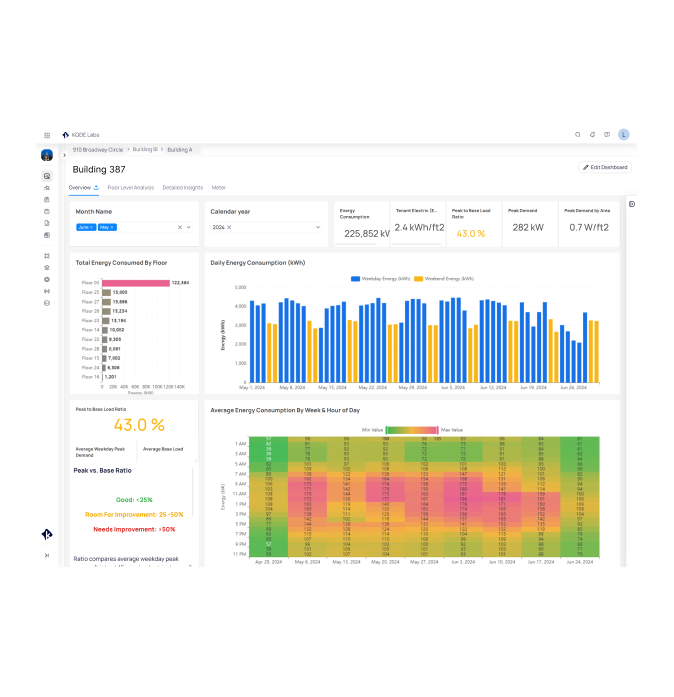
Gain a clear view of your building’s electric usage in real-time and over a set number of days to identify patterns, peaks, and areas for improvement. Use these insights to uncover energy-saving opportunities and optimize your systems for greater efficiency.

Track carbon emissions in real time, highlighting how your energy use impacts environmental performance. Identify trends and take actionable steps to reduce emissions and meet ESG goals.

Demand curves help you monitor power usage throughout the day and identify peak demand periods. By analyzing when and where energy consumption spikes, you can implement load-shedding strategies, optimize HVAC schedules, and reduce operational costs.

Break down demand by main meter to pinpoint areas of inefficiency. This detailed view allows you to identify high-energy zones, optimize equipment performance, and allocate resources where they matter most.

With clear, visual reporting on energy usage and carbon emissions, you can confidently share progress with stakeholders, report on ESG initiatives, and demonstrate the impact of your sustainability efforts.

Track trends in daily, monthly, and yearly energy consumption to understand trends and identify areas for improvement.

See exactly where energy is going with detailed usage breakdowns for lighting, plug loads, and HVAC

Highlight energy waste during off-peak hours and adjust systems to run only when needed.

Track utility consumption in real time and identify inefficiencies to optimize cost savings

Monitor energy and thermal usage across systems like lighting, HVAC, and hot water.
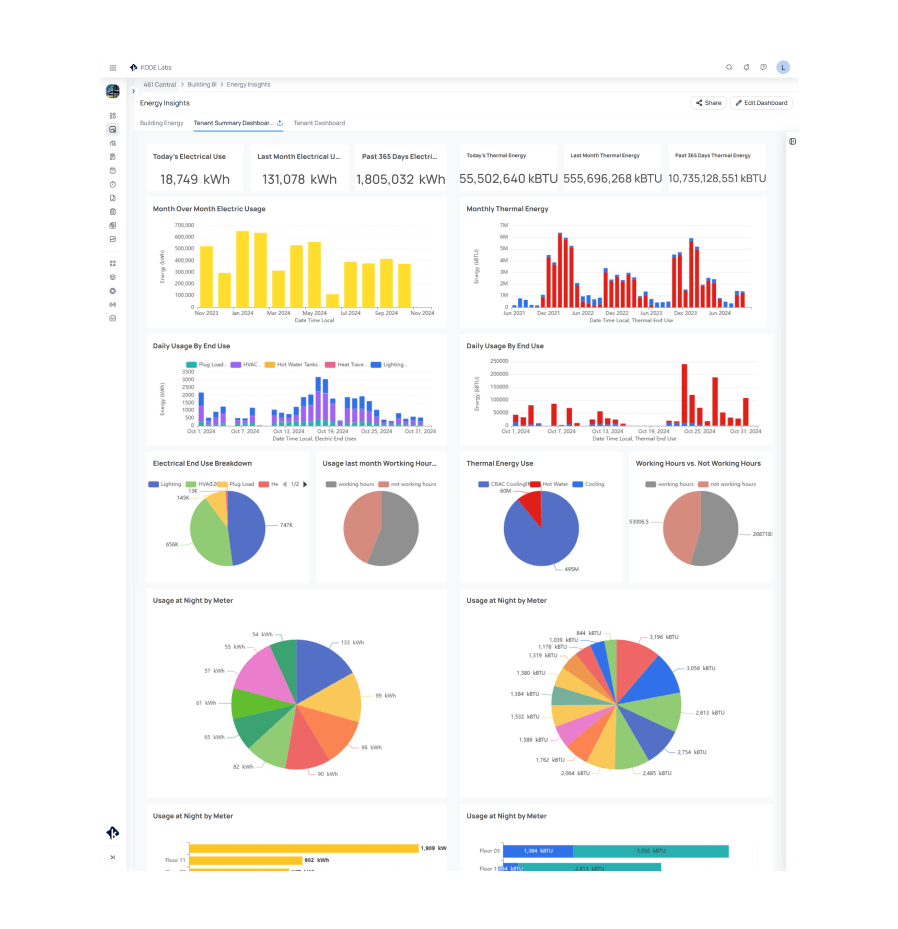

Pinpoint where energy is being consumed most with a detailed floor-by-floor breakdown. Prioritize efforts to optimize high-usage areas and reduce unnecessary waste.

Compare weekday vs. weekend energy use to identify inefficiencies and opportunities to align operations with actual building occupancy.

Identify the difference between peak energy use and baseline demand. Use these insights to reduce peak loads, flatten energy usage, and lower costs.

The Hourly Consumption Heatmap shows when energy demand is highest across weeks and hours. Use this data to adjust HVAC, lighting, and equipment schedules to match building usage patterns.

Track critical metrics like tenant energy intensity (kWh/ft²) and overall peak demand to measure efficiency improvements and communicate results to stakeholders.
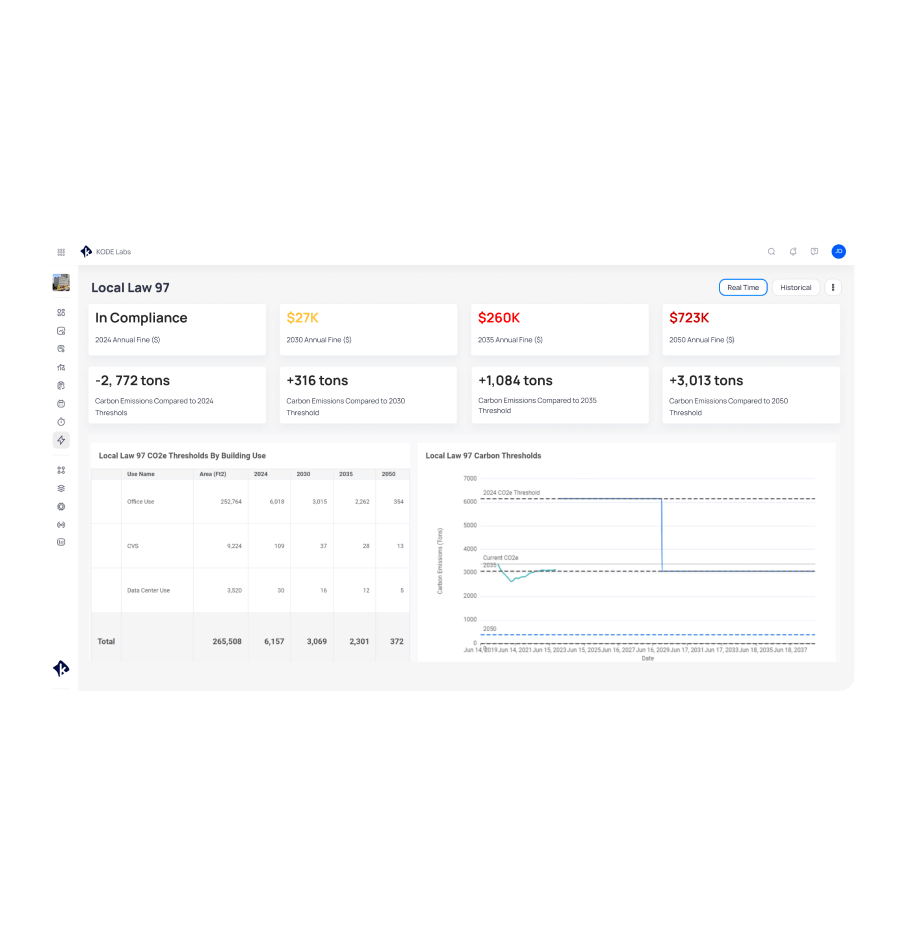

Instantly see your carbon emissions compared to Local Law 97 thresholds for 2024, 2030, 2035, and 2050. Know where you stand today and what’s needed to stay compliant tomorrow.

See projected annual fines for 2030, 2035, and 2050, helping you make informed decisions to avoid penalties and allocate resources effectively.

Analyze carbon output across asset types to identify where you need to focus energy reduction efforts.

Use threshold comparisons to forecast emission gaps and prioritize retrofits, operational adjustments, or upgrades to keep your building on track.

Optimize systems and workflows to lower carbon output, avoid penalties, and align with long-term ESG goals.
Consisting of over 2,000+ devices with 28,000+ points. The challenge was to optimize the building operations and cut down energy costs while offering amazing experiences to all the people who interacted with the building.
78000 + equipment runtime hours saved
3000 + equipment tested

OSS extends equipment lifecycles by over one year by reducing runtime on a daily basis, thus eliminating the need for over a year of equipment replacement ($3.4M total cost of replacement) from runtime savings alone.

The DTE Energy Retro-Commissioning (RCx) Program provides a professional study of your existing building and process systems. Program specialists help you optimize and improve comfort and functionality while decreasing energy and maintenance costs over time.
12.4 % annual electric savings
0.19 years payback time

The Chrysler House building was the first to implement KODE’s first machine learning solution – Optimized Start/Stop (OSS). The switch to KODE’s OSS resulted in clear energy savings, demonstrating the tangible benefits of integrating advanced technology with everyday building operations.
23 AHUs optimized
320 VAVs optimized
55 % reduction in wasted runtime

The data showed a substantial reduction in energy waste and operational costs. In the first month of implementation, we observed a 9.02% reduction in energy costs compared to the previous month.
The Empire State Realty Trust, one of the most successful Real Estate companies in New York City, with the iconic Empire State Building under its ownership, embarked on a new digital transformation venture that redefines the functions of the buildings in their portfolio and sets new standards in smart building management and sustainability.
30 systems across nine buildings

KODE OS is being used as a way to actively monitor G36 compliance as upgrades of the building’s controls are being implemented, equipping the ESRT team with real-time insights as their buildings are getting greener.
We are hard core believers that software leads hardware in driving the intelligence, efficiency, and sustainability of modern buildings. That is why all our solutions are meticulously architected, engineered, and built in-house, ensuring unparalleled quality and integration.
Cloud BMS enables building managers to monitor and control building systems like HVAC, lighting, and more from a centralized platform.
Cloud BMSBuilding BI visualizes the performance of every building system and IoT device in which KODE OS is integrated. This allows portfolio-wide reporting to the most granular level analysis, and everything in between.
Building BIFault Detection & Diagnostics (FDD), Digital Commissioning, and Preventive Maintenance come together to form a comprehensive Digital Maintenance strategy for your building or portfolio operations.
Digital MaintenanceData layer centralizes data from various building systems, integrating diverse sources into a unified database. By consolidating data, it enables KODE OS to process real-time information, analyze historical trends, and support advanced analytics, which are crucial for optimizing building performance.
Data LayerKODE OS streamlines smart building and facility management with over 150 pre-built API integrations, connecting a wide array of building systems, IoT devices, and third party software directly through the centralized cloud platform.
IoT PlatformWith the KODE Mobile App, manage building operations, respond to alerts, and access critical insights anytime, anywhere.
KODE Mobile App