By KODE Team
On this page
Subscribe to receive the latest blog posts to your inbox every week.
By subscribing you agree to with our Privacy Policy.
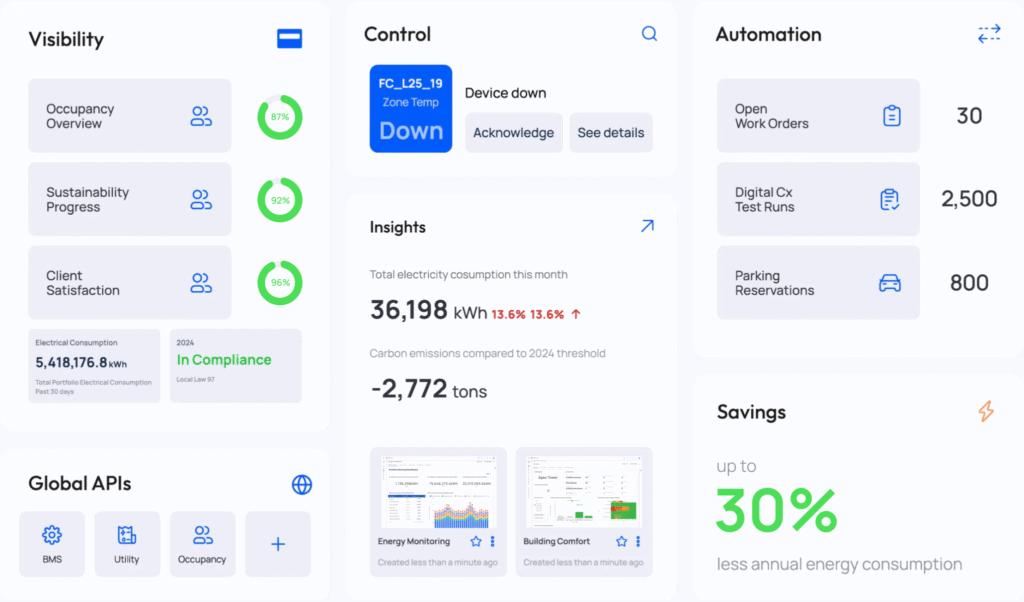
We’re excited to introduce Building Data Hub — a powerful new module within KODE OS designed to give you complete control over how your building data is transformed into actionable insights.
With a visual, drag-and-drop interface, Building Data Hub empowers operators, engineers, and analysts to ingest, transform, and publish metrics without writing code or relying on external data teams. Whether you’re creating KPIs for energy intensity, comfort scoring, or air quality, the Building Data Hub makes the process fast, scalable, and fully customizable.
From automating metric calculations to standardizing KPIs across portfolios, this release brings a new level of agility and intelligence to your building operations.
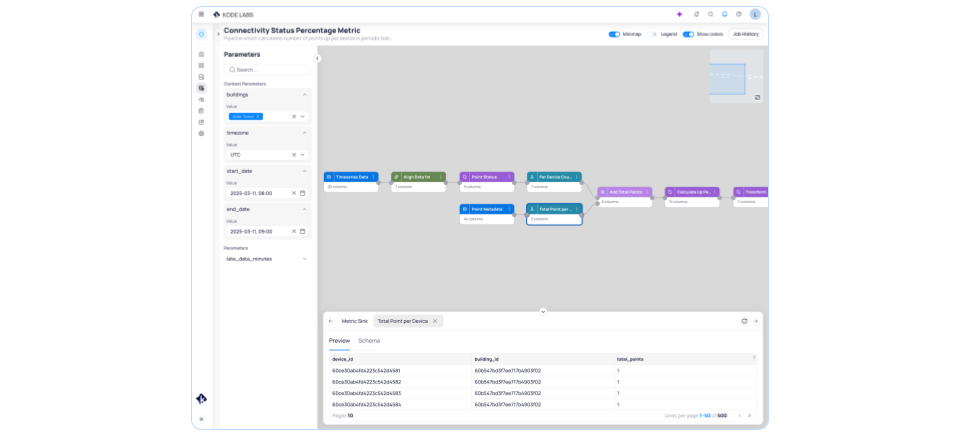
Create and manage custom data pipelines with an intuitive visual builder — no code required. Drag in your sources, define transformations, and push results to your dashboards or tenant tables.
Each step of your pipeline is fully configurable: group, join, filter, or calculate data as needed, and preview transformations in real time to validate accuracy.
Gone are the days of waiting weeks for analysts to produce new KPIs — now your teams can spin up new metrics in hours, adapting in real time to operational needs.
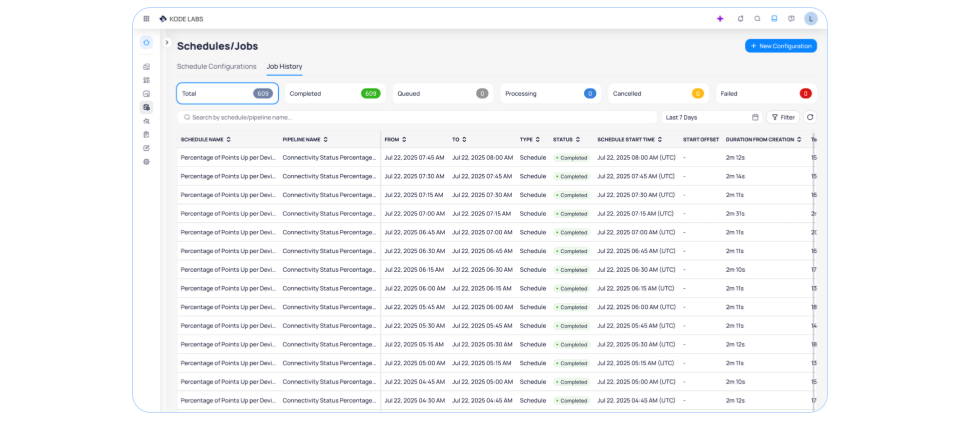
Keep your metrics fresh and automated. With Schedules & Jobs, you can define how often pipelines run — whether hourly, daily, or on custom intervals — ensuring your dashboards and reports always reflect the latest building conditions.
Plus, monitor job status and performance right from the platform. View run history, error logs, and resource usage to keep things running smoothly and transparently.
Last but not least, users can re-run pipelines to do historical data backfills so they can fill in missing metrics for retroactive analysis or compliance.
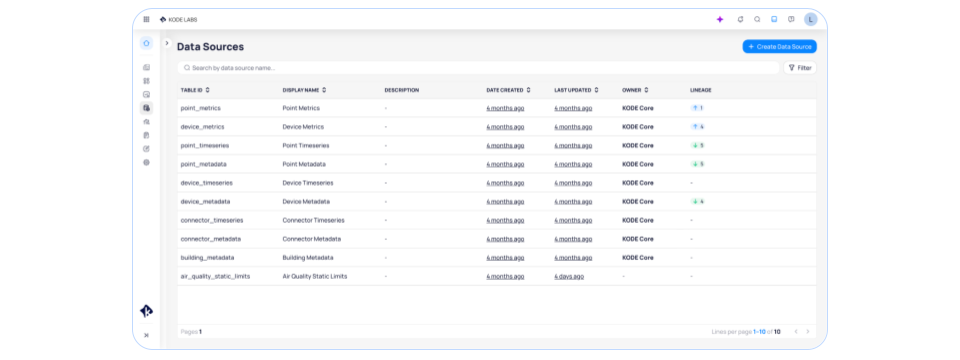
Seamlessly connect to all your building data sources — from sensor feeds to metadata tables. With support for time zone adjustments, filters, and dynamic parameters, you can tailor every data pipeline to the unique context of each building.
Whether you’re calculating site-specific comfort scores or rolling up data across a region, context-aware pipelines make it easy to stay accurate at scale.
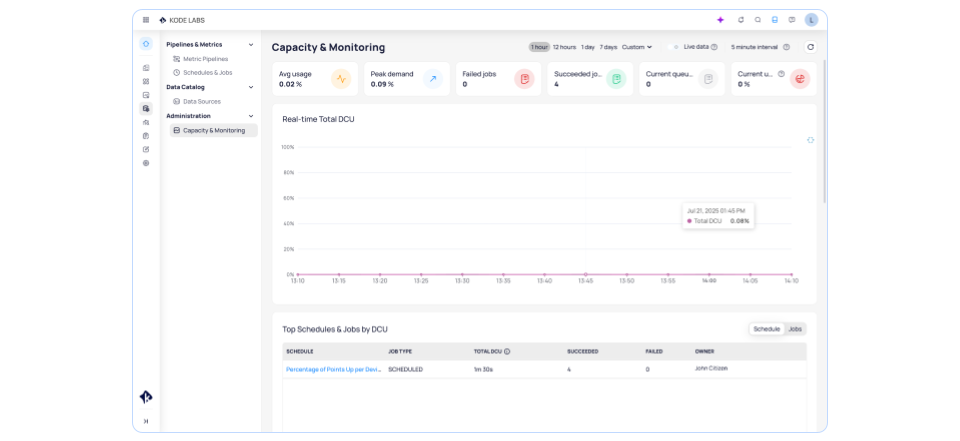
Keep tabs on performance, cost, and scale with full visibility into Data Compute Units (DCUs). Track how your pipelines are consuming resources and optimize for efficiency as your operations grow.
From local teams running a few key KPIs to enterprise portfolios deploying hundreds of metrics, Building Data Hub scales with you — with transparency and control built in.
In today’s world of smart buildings, insight and agility go hand-in-hand. But too often, building teams are stuck waiting on data science or IT to deliver the metrics they need.
Building Data Hub flips that script. It puts the power of data engineering into the hands of the people closest to building performance — enabling you to:
Whether you’re managing 3 buildings or 300, Building Data Hub gives you the tools to move faster, smarter, and on your terms.
KODE Team
News, insights and resources from the world of smart building management.
By clicking "Sign Up" you're confirming that you agree with our Terms and Conditions.