The latest from KODE
Your resource to everything you need to know about smart building operating systems
ResourcesA powerful no-code module to transform data. Build KPIs. Schedule jobs.
Sync to dashboards — all in one place.

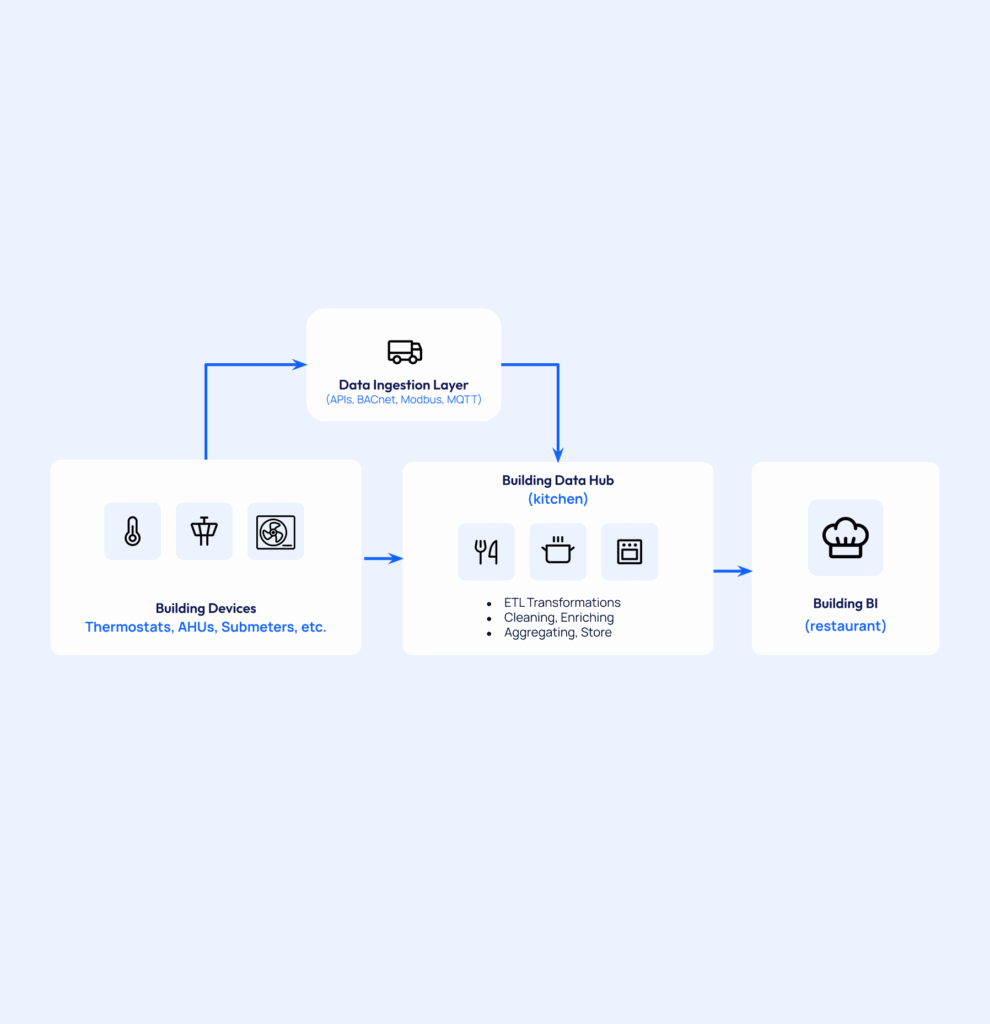
Building Data Hub is KODE’s low-code “data factory”. It ingests raw sensor data, cleans and transforms them into ready-to-use KPIs.
Building Data Hub prepares the data, Building BI serves the value

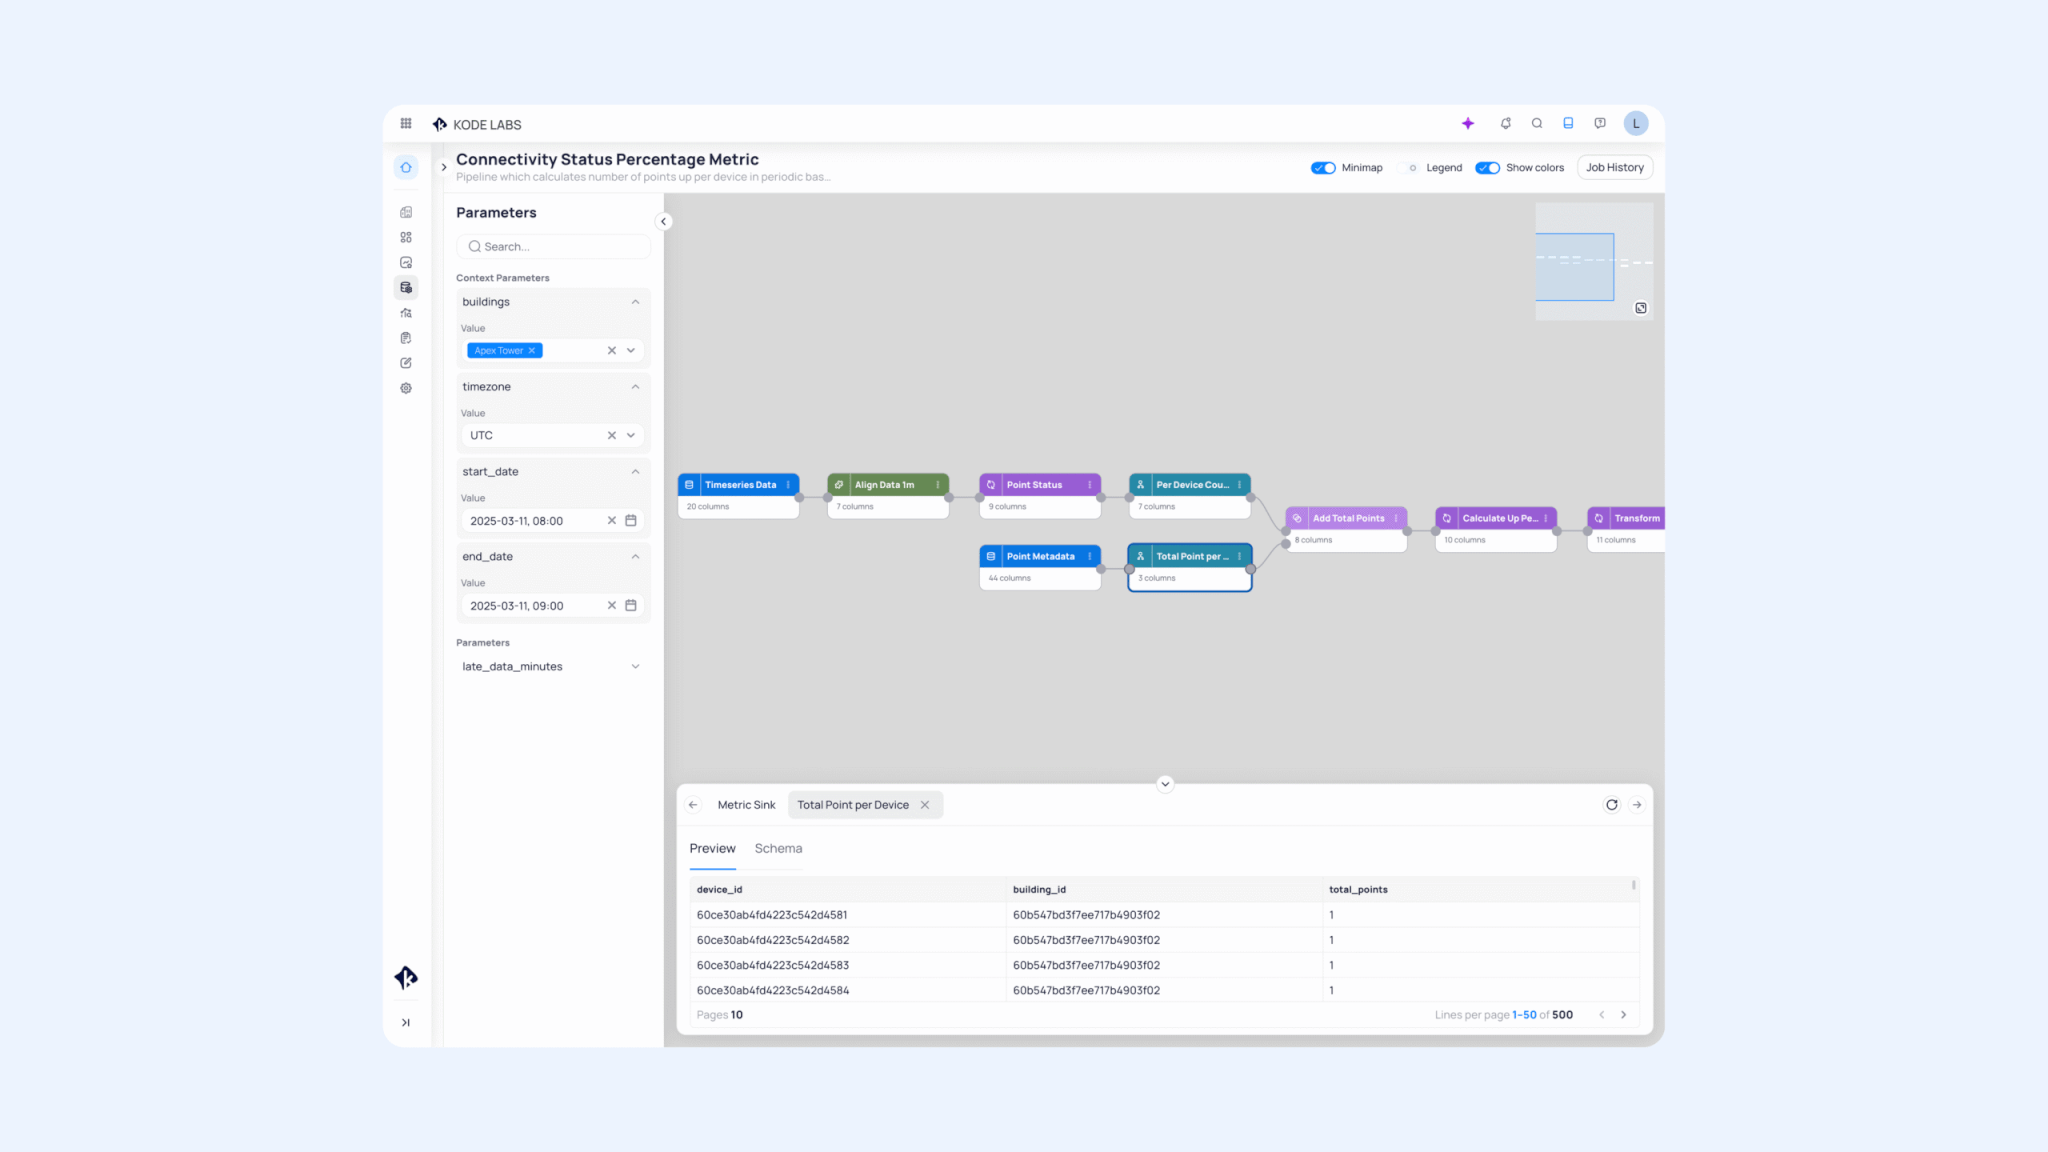
Create and manage your own data pipelines — from ingesting sensor data to writing custom KPIs — with a visual interface purpose-built for smart buildings.

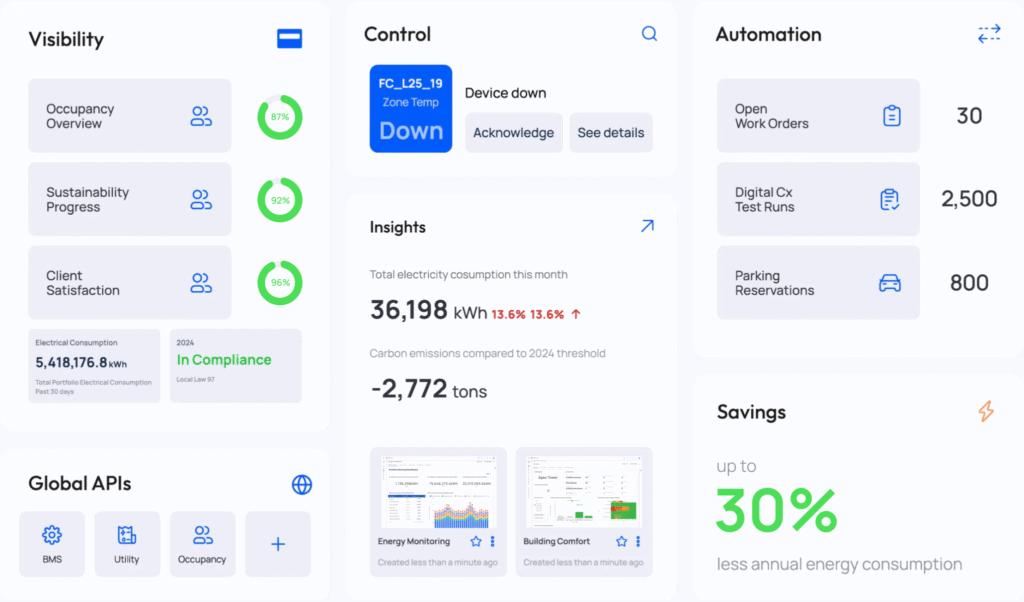
Transform raw data into insights like Air Quality Index or Energy Intensity Scores without writing SQL or waiting on technical teams.

Build once, deploy everywhere. Share, reuse, and monitor pipelines across your portfolio — with complete visibility into performance, costs, and schedules.

Your resource to everything you need to know about smart building operating systems
Resources
What does the Functional Testing Tool do? For building integrators, functional testing becomes difficult at scale. Testing one fan coil unit is manageable. Repeating the same test across hundreds of devices, documenting every step, identifying failures, and delivering a clear record to the client is where the process slows down. Manual testing requires technicians to […]
Read more
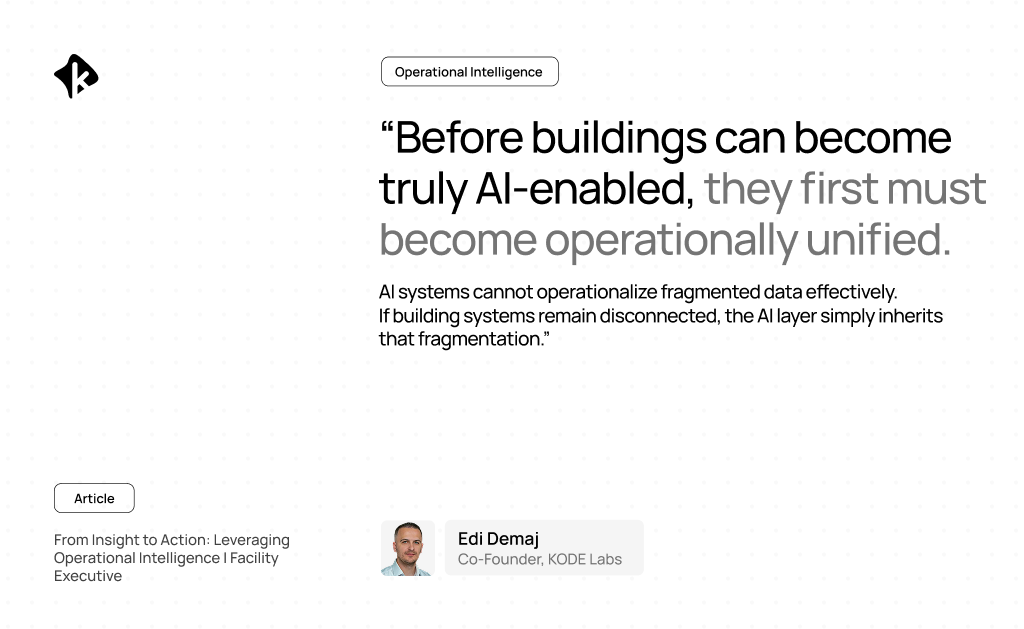
Originally published on Facility Executive The next phase of facility management relies on unified data streams to optimize building performance, drive efficiency, and shift from reactive to predictive maintenance. The commercial real estate industry has spent the better part of a decade digitizing buildings. Sensors have multiplied; dashboards have expanded. Analytics platforms, occupancy tools, energy […]
Read more
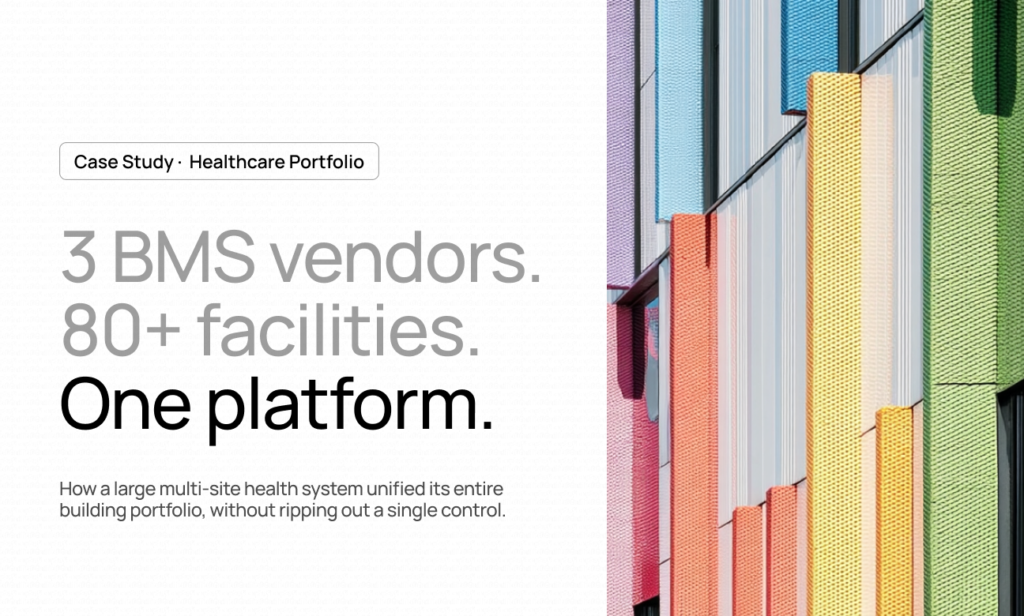
What Is a Hospital Building Management System? A hospital building management system is the software that monitors and controls a facility’s mechanical, electrical, and life-safety equipment: HVAC, air handling, chillers, pressure and humidity in clinical spaces, metering, and alarms. In most large health systems, however, that “system” is actually several systems. Different buildings were commissioned […]
Read more
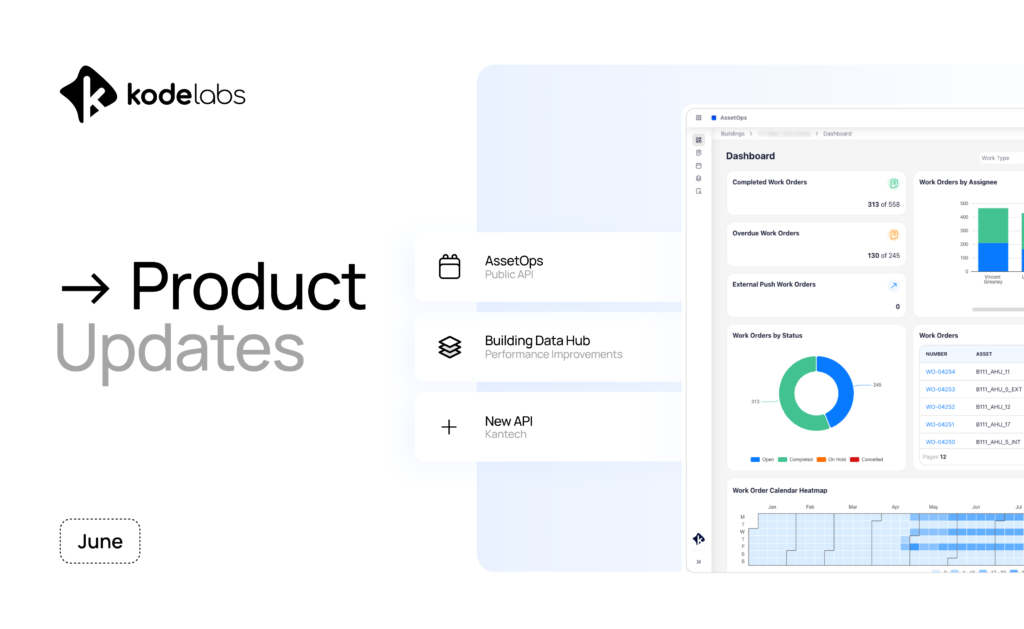
June strengthens the KODE OS integration ecosystem with a new governed Public API for AssetOps and expanded connectivity for physical security systems. Together, these updates make external integrations more secure, scalable, and easier to manage across enterprise portfolios. Here’s what’s new. AssetOps Public API Governed Access for External Integrations We’ve introduced a new native Public […]
Read more
June was about strengthening governance across the platform. As KODE OS scales across larger portfolios and more enterprise deployments, governance becomes just as important as functionality. This month’s updates focused on giving teams greater control over external integrations, simplifying operational administration, improving platform performance, and continuing to expand the connected ecosystem. Here’s what shipped, grouped […]
Read more
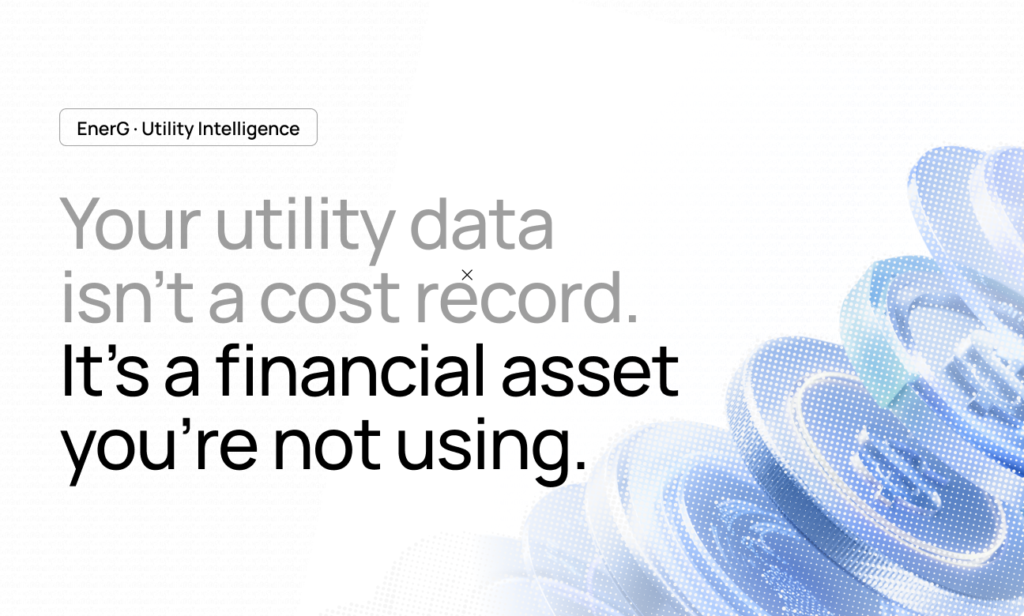
“Isn’t this just another utility reporting tool?” It’s the first question almost every Energy or Sustainability leader asks when EnerG enters the conversation. And it’s a fair one. Most enterprises have already invested in something that touches utility data, a bill payment platform, a sustainability portal, a spreadsheet a long-tenured analyst built five years ago, […]
Read more

In 2026, every corporate real estate team faces the same question: Do we still need all this office? Answering it well comes down to one thing: office space utilization data, clear enough to act on. The hybrid-work debate has cooled. Meanwhile, the real-estate-cost debate has not. Leases are coming up for renewal. Budgets are tightening. […]
Read more
What does Fault Detection & Diagnostics do? For building integrators, every truck roll has a cost. A technician sent out for a minor issue is lost time. A technician sent out for no real issue is worse. The hard part has never been a lack of data. Building systems generate plenty of it. The hard […]
Read more