On this page
Subscribe to receive the latest blog posts to your inbox every week.
By subscribing you agree to with our Privacy Policy.
Guide to the effective implementation of ASHRAE G36 standards. It outlines a step-by-step process to ensure compliance and optimal performance, leveraging KODE OS tools for streamlined execution and monitoring.
With upcoming and existing regulations regarding energy efficiency and usage, it has been even more critical for building owners to implement projects that they can trust will help them achieve these goals. One of these projects is to implement devices that have trim and response programming, as defined in ASHRAE Guideline 36 (G36).
As is common in the industry, this type of work can require a symphony of vendors and scopes of work that can be difficult to manage and even more difficult to hold the right parties accountable for the work performed within an actionable period of time.
Providing visibility into these types of projects is difficult, which is why KODE Labs has designed a G36 Validation Framework that provides visibility into the specific challenges of G36 implementation from deployment to continuous monitoring, minimizing the time between discovery and action, so that building owners feel empowered throughout the process.
The core of the KODE OS G36 solution is the definition of three distinct phases of G36 deployment:
Phases are designed to isolate issues that should be associated with a specific vendor(s), taking the guesswork out of knowing who to contact to keep your project moving forward.


Validation of points & data
All phases are dependent on the data from the devices being properly identified and proven to be trustworthy.

Sequence commissioning
Each device must pass two tests: A. Basic point writability & component tests.

Evaluating initial equipment operation
The unfortunate truth is that even though your devices are programmed with G36 sequences, there may be other factors influencing how well any given device is operating to achieve the goals of G36. Some of these factors are nuanced and difficult to spot. To assist with this, we developed a basic G36 scoring framework and dashboards to help identify and prioritize devices that may need attention.
G36 Scores are presented as a 0-100 value, but should be used only as a qualitative measure to compare against similar devices. By itself, the number doesn’t have a specific meaning.
For example, a score of 90 should not be interpreted as “this device is operating near perfectly,” but instead used to compare against a similar device that has a different lower score as an indication that the lower scored device may need investigation.
Once through the above three phases of deployment, the platform can be put on “cruise control”, leveraging the sophisticated scheduling features now available in our Functional Testing Tool, and automated notifications from Fault Detection & Diagnostics application.
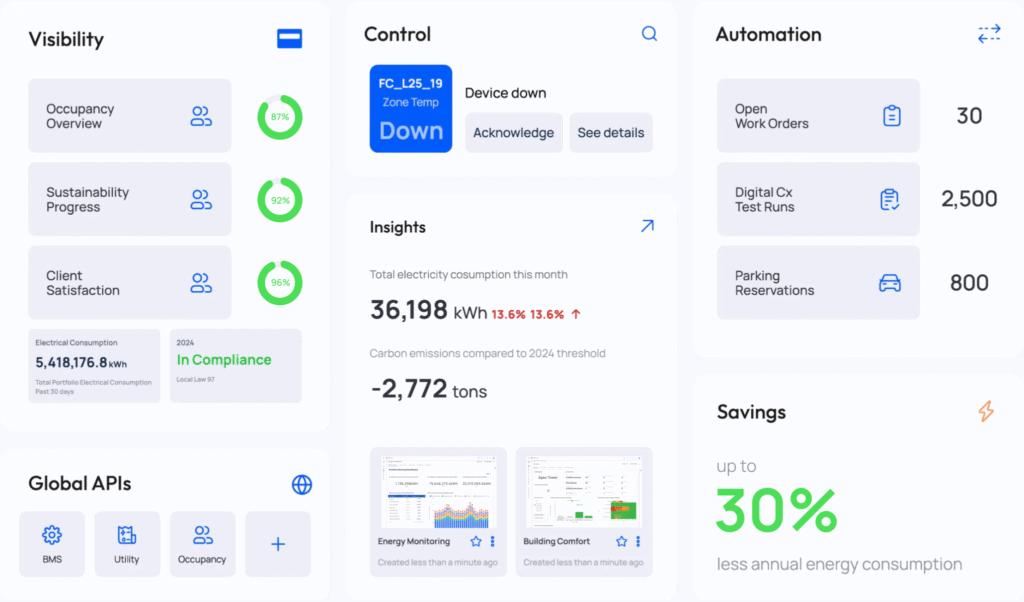
KODE Lab’s complete G36 Companion currently utilizes 3 applications within KODE OS:
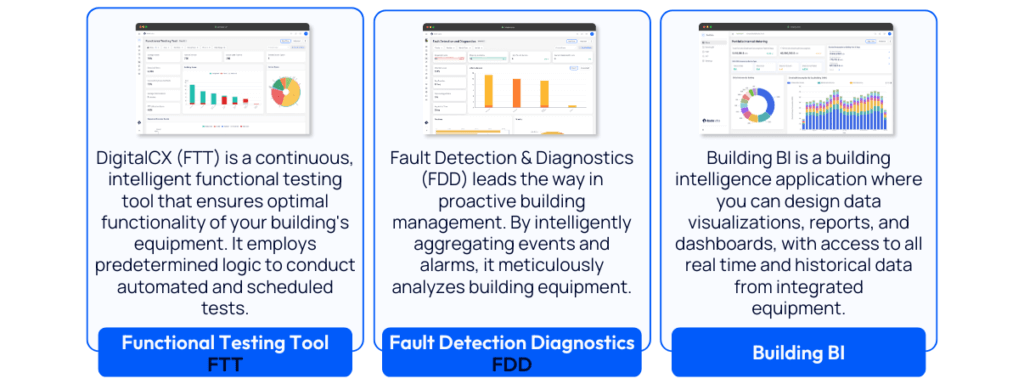
Some of the solutions described in this document are explicitly defined in G36, and some are features that we built into KODE OS to assist in communicating the deployment status and continuous operation of equipment IAW that guideline.
A summary of these features are as follows:
KODE: G36 data quality dashboard in Building BI
KODE: G36 sequence monitoring with dashboards & scoring in Building BI
KODE: G36 sequence testing with Functional Testing Tool (FTT)
Getting started
What are the goals of the phase?
To remove the integrator as the potential source of missed G36 functionality
How we implemented the phase
For this early stage, we provide a simple matrix in BBI so that integrators can keep track of which points are templated. This should be considered an internal tool for only the integrators and should not be visible to the end-user.
Requirements to enter phase
None.
Requirements to exit phase
Integration complete, all points available for templating have been templated.
Artifacts & Deliverables [DESIRED]
Punch list of points not available to integrators for templating.

We recommend the following phases of deployment for each scope-of-work. In this context, a scope-of-work is a defined set of devices, and should be able to be tested on the zone-group level (meaning grouping an AHU with its child VAVs).
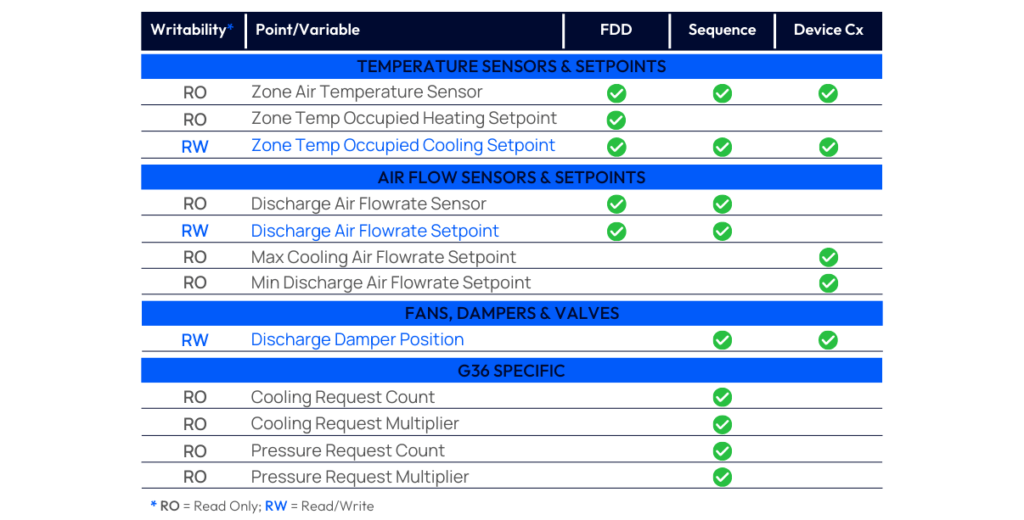
One of the most important things to establish early in the process is providing a list of expected points for each device type in order for any of them to get out of phase 1.
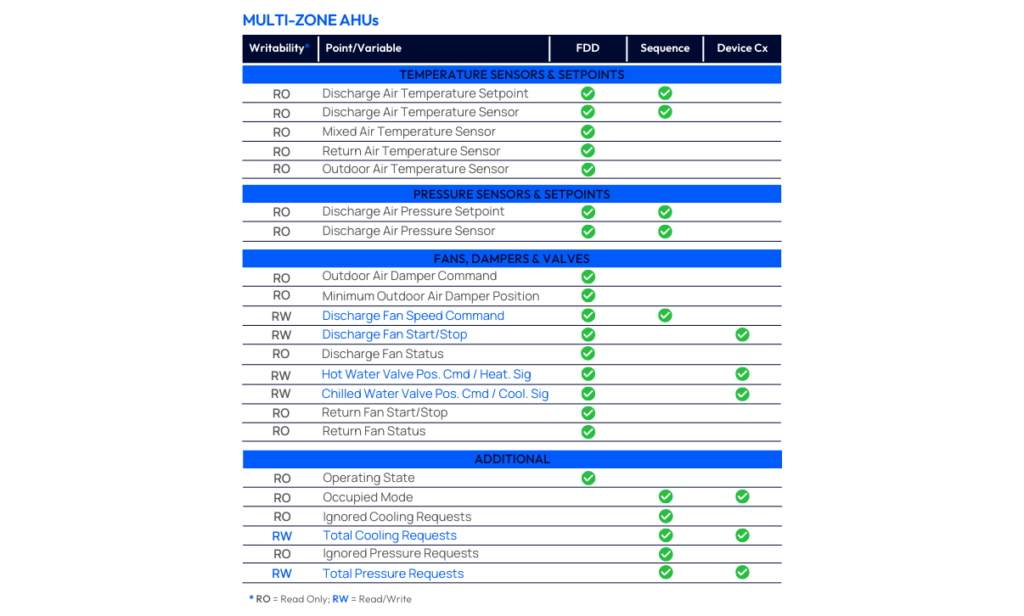
Each point identified can be used as input to several applications and/or downstream analyses. These distinctions are made using the columns in each table in this section.
It should be noted that in this phase, we are only looking for templating coverage. Evaluation of coverage regarding downstream features is part of Phase 1 of deployment. The matrices that are provided in the following section are only to give context as to why these points are needed.
These points are required IAW the Automated Fault Detection & Diagnostics and Alarms sections of G36.
Points designated in these columns are needed as inputs into KODE Lab’s G36 Sequencing Scoring Metrics, available within the Building BI application, and also for Sequence Testing through our Functional Testing application (FTT / DigitalCx).
In this context, “Testing” is referring to the G36 defined device testing that commissions the functional components of a device.
TERMINAL UNITS (VAVs)
MULTI-ZONE AHUs
Deployment Phase 1
What are the goals of the phase?
Provide visibility into gaps between deployment and what is needed to enable G36 validation features.
How we implemented the phase
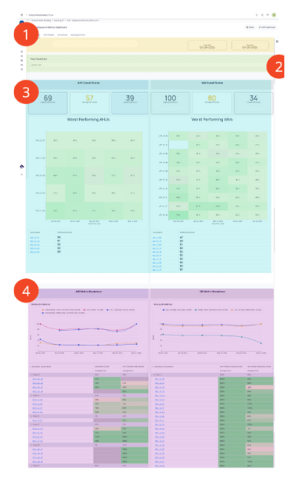
This phase is implemented using “G36 – Data Quality”. This dashboard is designed so that a user can get a floor-level understanding of the status of the G36 deployment.
Requirements to enter phase
Requirements to exit phase
Artifacts & Deliverables [DESIRED]
Reports on project needs for each vendor.
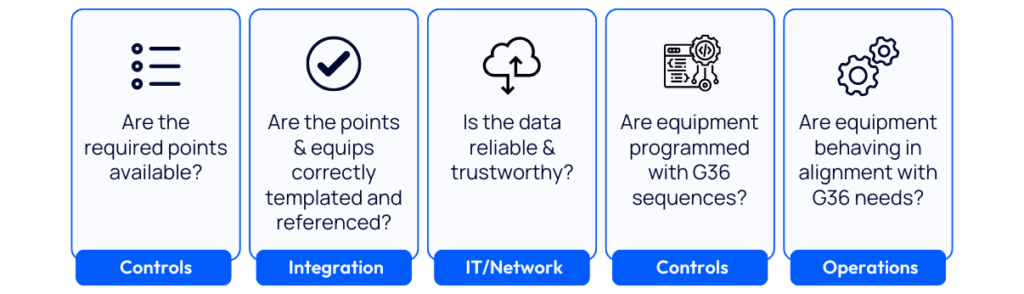
In this phase, we provide tools in Building BI to assist in answering the following three questions:
Phase Tools
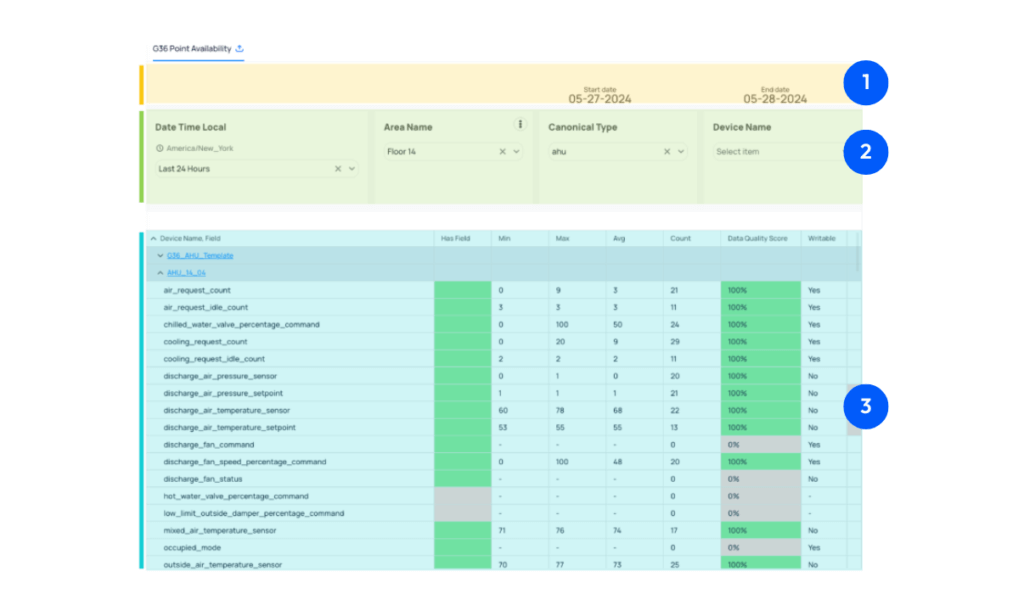
ANATOMY OF THE USER INTERFACE (UI)
The User Interface (UI) is divided into three major components:
Dashboard data scope
This tells you which building and date frame of which the data in the bottom table is being presented. Note that a 24 hour period has been chosen as the goal of this dashboard is to present the user with current information on data being received and assigned to the identified ontological field.
Filters
Here you can choose a different scope of time to view the available data, and narrow down to specific floors, device types, and even down to a specific device. Note that depending on the range of data you are looking at, larger sets of data may take longer to load. Reduce loading time by keeping the filters as narrow as possible to achieve your goal.
Pivot table of filtered data
Here is where you will achieve the goals of this phase. Details of this are described in the next section.
HOW TO USE THIS TOOL
The narrowest way to look at this data is to view a single device. For any given device you can answer questions about your data using these columns. The columns are arranged so that the answers build on each other to give a comprehensive understanding of the data being received from this device. Column goals are as follows:
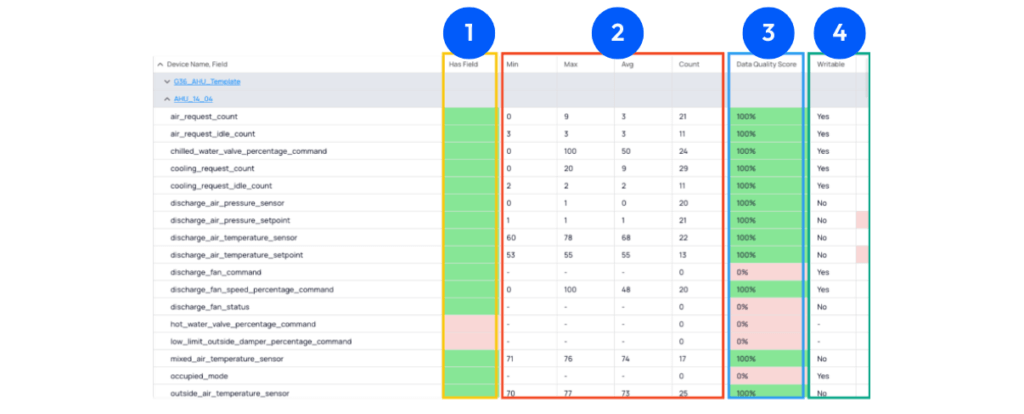
Is the point available?
If the point has been templated, this will show as a green shaded box, if it has not, it will be red. If the cell is red, then no other columns, derived from device-specific data, to the right of it can be calculated.
What range of time-series data are we seeing for this point?
You should expect a reasonable min/max/avg across several samples (denoted by ‘count’). Other conditions can also be discovered:
Is the time-series data trustworthy?
Currently, our data quality score only looks at a reasonable range of values for a given field. For example, we would suspect a failed temperature sensor if it read below -30F or above 250F. Use this column in conjunction with #2 to help identify the specific issue that needs to be addressed.

Are the required points writable?
There are two columns in this category. “Writable” is looking at the point meta to determine if it inherited a writable designation from the BMS. The narrow column at the very end of the table will be shaded RED if this value is reporting “No” but the point is required to be writable to perform necessary tests.
Deployment Phase 2
What are the goals of the phase?
The goals of this phase are to provide a list to controls contractors of:
How we implemented the phase
Perform tests in FTT to:
Requirements to enter phase
Phase 1 exit requirements met.
Requirements to exit phase
Testing has been completed on all devices within project scope.
Artifacts & Deliverables [DESIRED]
With all the foundational work done, devices are ready to be commissioned for G36 sequences. These tests can be configured in advance in our Functional Testing Tool , needing only to hit “run” once Phase 1 is complete! Algorithms for testing sequences are described in the following page.
VAV REQUESTE FOR COOLING NEEDS
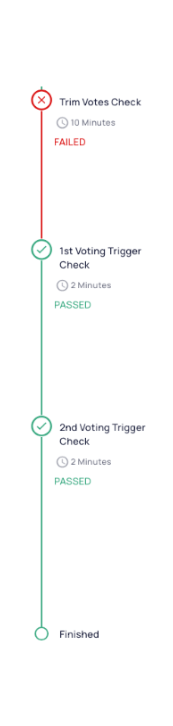
The test to validate the G36 cooling request programming on a VAV is sectioned into three sequences, each contributing 33% to the overall testing score:
01 – Validate that when the difference between sensor and setpoint is less than 3, that the VAV is sending < 2 votes.
02 – Validate that unit is correctly sending 2 cooling requests to its AHU when the difference between sensor and setpoint is between 3F and 5F.
03 – Validate unit is correctly sending 3 cooling requests to its AHU when the difference between sensor and setpoint is 5F or greater.
VAV REQUEST FOR PRESSURE/FLOW NEEDS
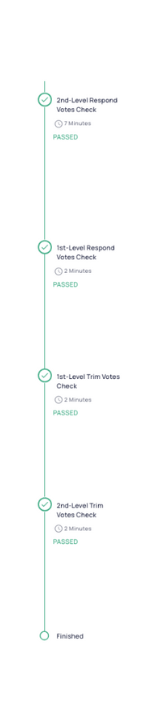
The test to validate the G36 cooling request programming on a VAV is sectioned into three sequences, each contributing 33% to the overall testing score:
01 – Validate unit is correctly sending 3 pressure requests to its AHU when the damper is fully open when the actual airflow detected is over 70% below setpoint.
02 – Validate unit is correctly sending 2 pressure requests to its AHU when the damper is fully open when the actual airflow detected is between 50% and 70% below setpoint.
03 – Validate unit is correctly sending 1 pressure request to its AHU when the damper is fully open with the actual airflow detected is within acceptable range of setpoint.
04 – Validate unit is correctly sending 0 pressure requests to its AHU when the damper is not fully open when the actual airflow detected is within acceptable range of setpoint.
Deployment Phase 3
What are the goals of the phase?
The goal of this phase is to provide a comprehensive picture of equipment operation upon initial deployment.
How we implemented the phase
The phase is implemented using a combination of:
Requirements to enter phase
Phase 2 exit requirements met.
Requirements to exit phase
Artifacts & Deliverables [DESIRED]
Now that the devices in the scope-of-work have been verified to be operating with the correct sequences, it is time to use KODE’s Fault Detection & Diagnostics to get a baseline understanding of how your equipment is performing. We recommend an initial 1 month period where any initial findings can be isolated and fixed.
Phase Tools
The G36 Sequence Metrics Dashboard contains the following tabs:

Building
Use this to get a comprehensive look at an entire building or floor. Use this to identify specific devices that requires investigation.
AHU details & VAV details
Use the information in these tabs to investigate scores for specific devices.
Scoring criteria
This tab contains the reference information regarding the details on what the scoring criteria are and how they are calculated.
BUILDING TAB: ANATOMY OF THE UI & USAGE
This first tab is meant to be a starting point in the process of understanding and troubleshooting deficiencies in operations and G36 sequences. Alone, the numbers being presented here should only be used as reference against similar devices for prioritization in lieu of a concrete number representing quantitative evaluation of performance.
01 – Dashboard data scope: This tells you which building and date frame of which all the subsequent data is being presented.
02 – Filters: Here you can narrow down the data to a specific floor.
03 – Overall Scores: These are the highest level scores, and should only be used to help identify outliers to investigate. Scores at this level are really more of a qualitative measure than quantitative. Each score is an average of several related metrics.
04 – Score Breakdowns: This section will give you a better idea regarding why a particular score may be low.
A. Is it operating poorly across all metrics? Or is it just one of them?
B. If just one, is the poor score related to a sequence metric or an operational one?
AHU & VAV DETAILS TABS: ANATOMY OF THE UI & USAGE
Intentionally, the AHU Details and VAV Details are similarly oriented. The purpose of these tabs are to really dig in deep, down to the time-series data, to understand how a particular piece of equipment is performing regarding G36 sequences.
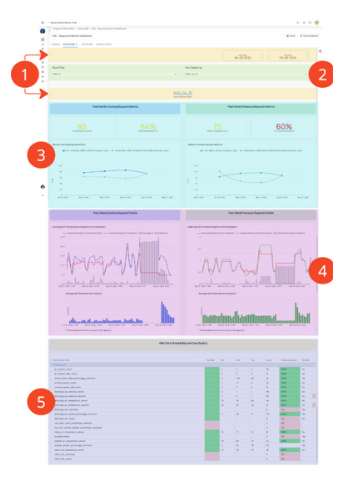
01 – Dashboard data scope: This tells you which building and date frame of which all the subsequent data is being presented.
02 – Filters: Here you can select a specific device of which you want to see the relevant G36 sequence data.
03 – Past month metrics: This section is showing the weekly score progression for this device over the past month. This can be used to get a good feel for score trends and how one metric may be trending vs another. Further investigation is available in the section below.
04 – Score Breakdowns: Here, you will see the past week of time-series data for these points as a 15min rolled-up averages.
– The combination (line & bar) chart quantifies the divergence of the sensor from setpoint.
– The bar chart below, indicates the number of requests either as a total (on the AHU details) or from that specific device (on the VAV details).
– Using this set of charts gives a good overview of how well this device is responding to requests.
05 – Data quality: This is the same table available in the G36 Data Quality Dashboard, but is only the points specific to this device.
News, insights and resources from the world of smart building management.
By clicking "Sign Up" you're confirming that you agree with our Terms and Conditions.

Why Smart Buildings Need More Than Software Most smart buildings today are surrounded by technology, but very few are truly…
Read more
What Is Proactive Maintenance? How to Use This Guide Proactive maintenance means finding and fixing building issues before they become…
Read more
Explore a diverse range of practical use cases designed with tenants in mind, from streamlining operations to delivering innovative user…
Read more