By Olta Beka
On this page
Subscribe to receive the latest blog posts to your inbox every week.
By subscribing you agree to with our Privacy Policy.
In IoT and smart buildings, data is everywhere, but insight is rare. In this HR Journal conversation, Max explains how Mission Control turns building data into real outcomes, separating noise from signals, applying Digital Twins and ontologies for context, and pairing end-to-end ownership with curiosity to make insights reliable and actionable.
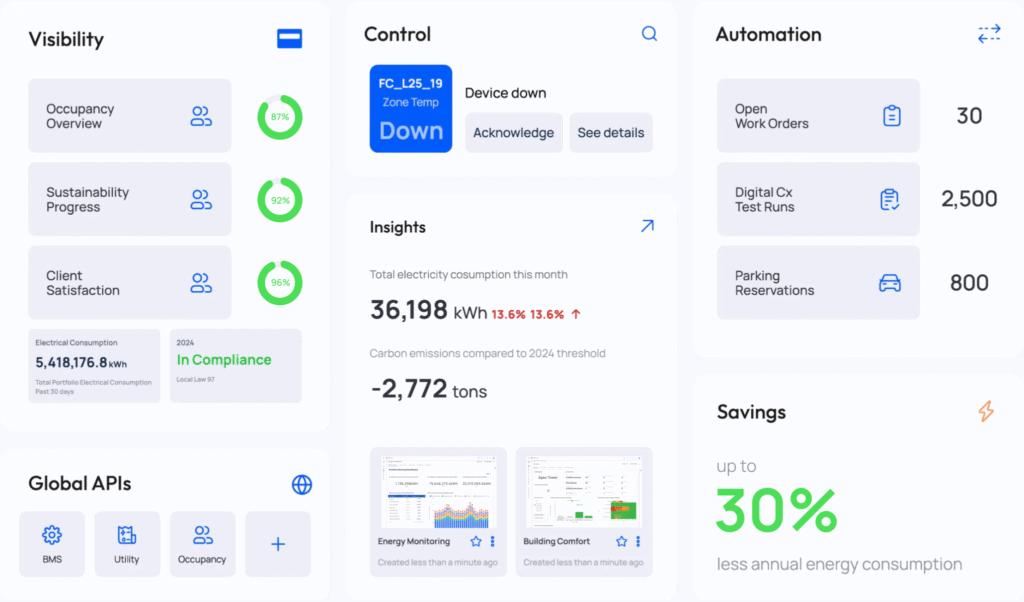
We separate noise from signal by starting with the outcome, not the data. What does the client actually care about: energy efficiency, tenant comfort, or asset longevity? We anchor our models to those priorities. Context is key: a temperature reading alone is noise, but mapped to a zone, an AHU, and historical trends, it becomes insight. Structuring the data properly turns telemetry into actionable stories.
Digital Twins help us understand relationships, not just points. A temperature spike may relate to occupancy, runtime, or weather. Ontologies give structure, letting us deliver analytics at scale across buildings and portfolios. At the heart of any dashboard is a clean, reliable model, without it, insights are just disconnected numbers.
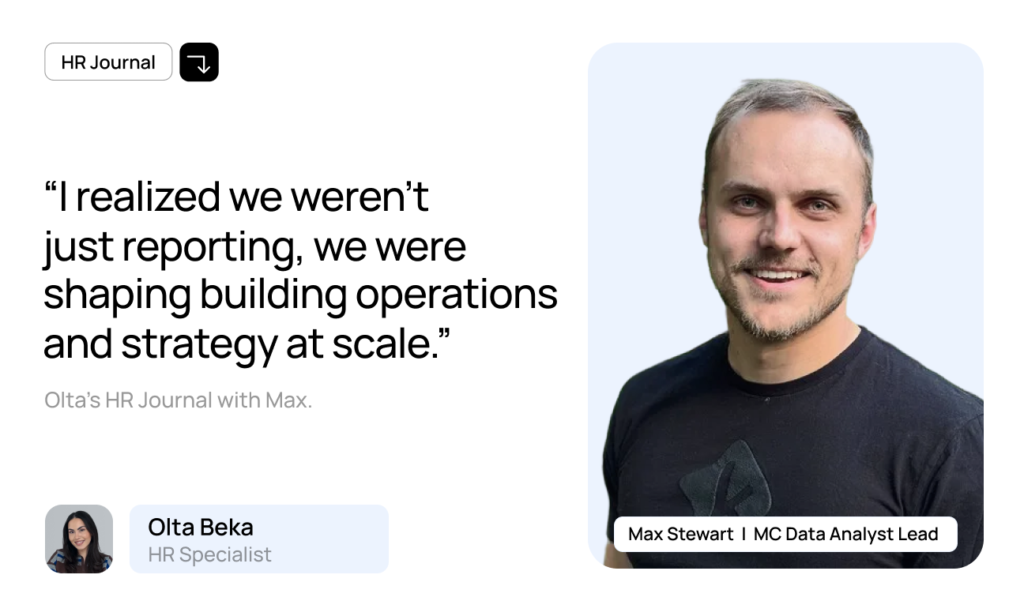
The first 90 days were about listening & learning, to the tech, the product, and the people operating the buildings. I focused on how data moved through the platform and where decisions were actually being made. The ‘Aha!’ moment came when I realized we weren’t just reporting, we were shaping building operations and strategy at scale.
Curiosity – that’s the secret soft skill weapon in Mission Control. Data rarely behaves as expected, and asking “why?” uncovers patterns others miss. Communication is a close second, insight is only valuable if someone can act on it.
End-to-end ownership starts before a dashboard exists. We need to understand the client’s pain points, shadow their daily operations, see what modules they’re hoping to leverage, and know what devices are installed. Only then can we build analytics that truly solve real problems. Ownership means carrying that understanding from raw data through to a finished dashboard.
Learn how buildings work. SQL and dashboard can be taught. Understanding HVAC, BMS, asset hierarchies, and operations is what makes you effective. The best analysts bridge digital data with physical reality.
“I can do more than you’re asking.” Most buildings are under-optimized, systems drift over time, and small operational tweaks could have big financial and sustainability impacts. Often, issues aren’t failures, but misconfigurations.
It’s the people. The Mission Control Data Analytics team is a feature in itself, building micro-products tailored to each building, user, and pain point. Every dashboard that saves money, highlights a trend, or simplifies multiple screens comes from analysts who know the building intimately.
The team relies on every KODE feature to work properly, trust in the platform is key, and the wider KODE team always delivers. None of this happens without their day-to-day effort. It’s astonishing how quickly client requests become core features. I’m amazed daily by the intelligence, drive, and passion across KODE. If I had to pick a favorite feature, it’s the team making it all happen.
The takeaway from Max is that end-to-end ownership starts long before the dashboard. You begin by shadowing day-to-day building work, learning the pain points, what devices are installed, and what outcomes matter most. Then you carry that understanding from raw data through to what the user sees. And curiosity is what keeps you asking “why?” until the insight is clear enough for someone to act on.
Coming soon, another HR Journal conversation. Stay tuned!
Olta Beka
HR Specialist, KODE Labs
News, insights and resources from the world of smart building management.
By clicking "Sign Up" you're confirming that you agree with our Terms and Conditions.
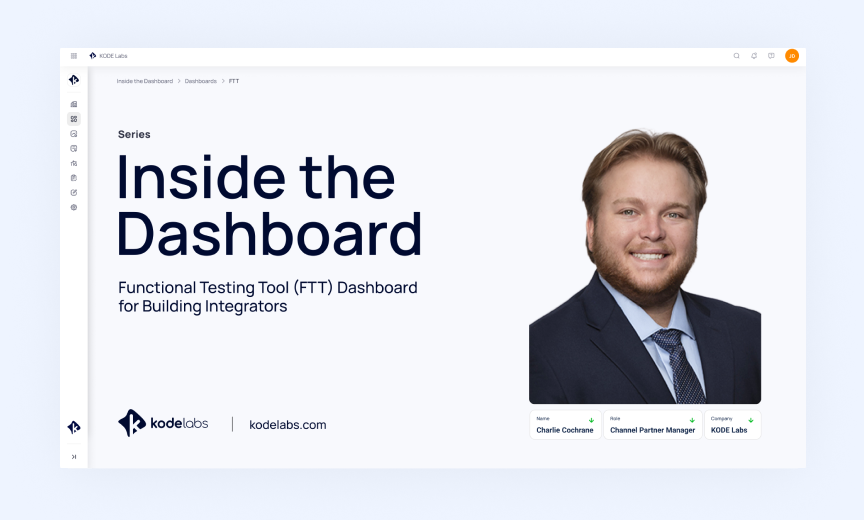
What does the Functional Testing Tool do? For building integrators, functional testing becomes difficult at scale. Testing one fan coil…
Read more
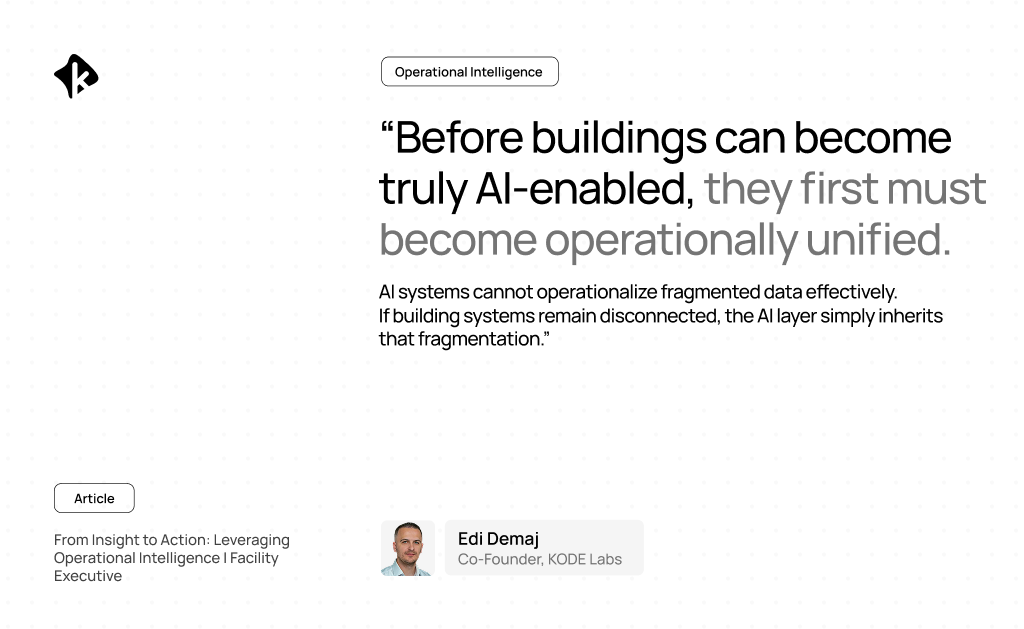
Originally published on Facility Executive The next phase of facility management relies on unified data streams to optimize building performance,…
Read more
June strengthens the KODE OS integration ecosystem with a new governed Public API for AssetOps and expanded connectivity for physical…
Read more