By KODE Team
On this page
Subscribe to receive the latest blog posts to your inbox every week.
By subscribing you agree to with our Privacy Policy.
In today’s real estate landscape, sustainability isn’t just a value, it’s an expectation. Whether driven by internal ESG commitments, regulatory mandates, or stakeholder scrutiny, organizations are being asked to show their work. That means turning fragmented building data into structured, auditable reporting.
This article walks through how KODE OS simplifies these processes, from data ingestion to disclosure, helping Sustainability teams and Executives stay both compliant and confident.
For sustainability teams and C-level executives alike, ESG disclosure can feel overwhelming. Key metrics like energy usage, emissions, occupancy, and cost are often scattered across utility providers, legacy BMS systems, spreadsheets, and third-party software/auditors. Data quality issues including missing records, duplicates, uncalibrated meters, and more, create delays and risk inaccuracies. And with increasing scrutiny from stakeholders and regulators, there’s little room for error.
Most real estate portfolios suffer from:
This complexity makes it difficult to align with frameworks like GRESB, CDP, or regulatory mandates like LL97 or CSRD.
KODE OS, through its EnerG module and its features, addresses these challenges head on. It transforms fragmented building and utility data into structured, real-time insights. Automated, auditable, and aligned to your sustainability goals.
Here’s how it works:
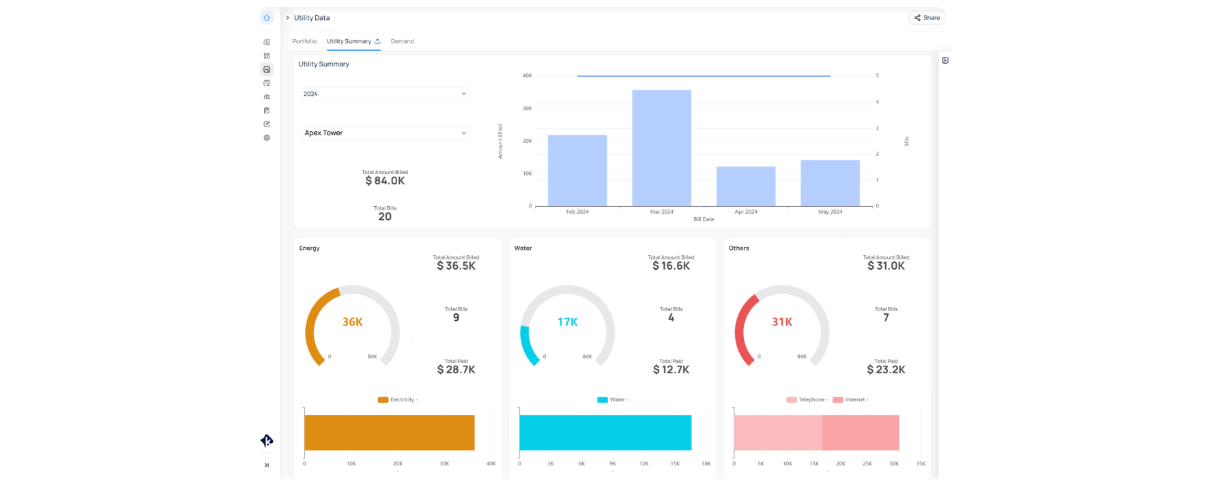
KODE OS connects to over 250 data sources, from building automation systems, IoT devices, utility providers, interval meters, third party platforms and more.
The result = consistent collection of:
All ingestion is automated, but also flexible enough to support manual uploads when needed, such as historical data, one-off statements, or input from systems without API access.
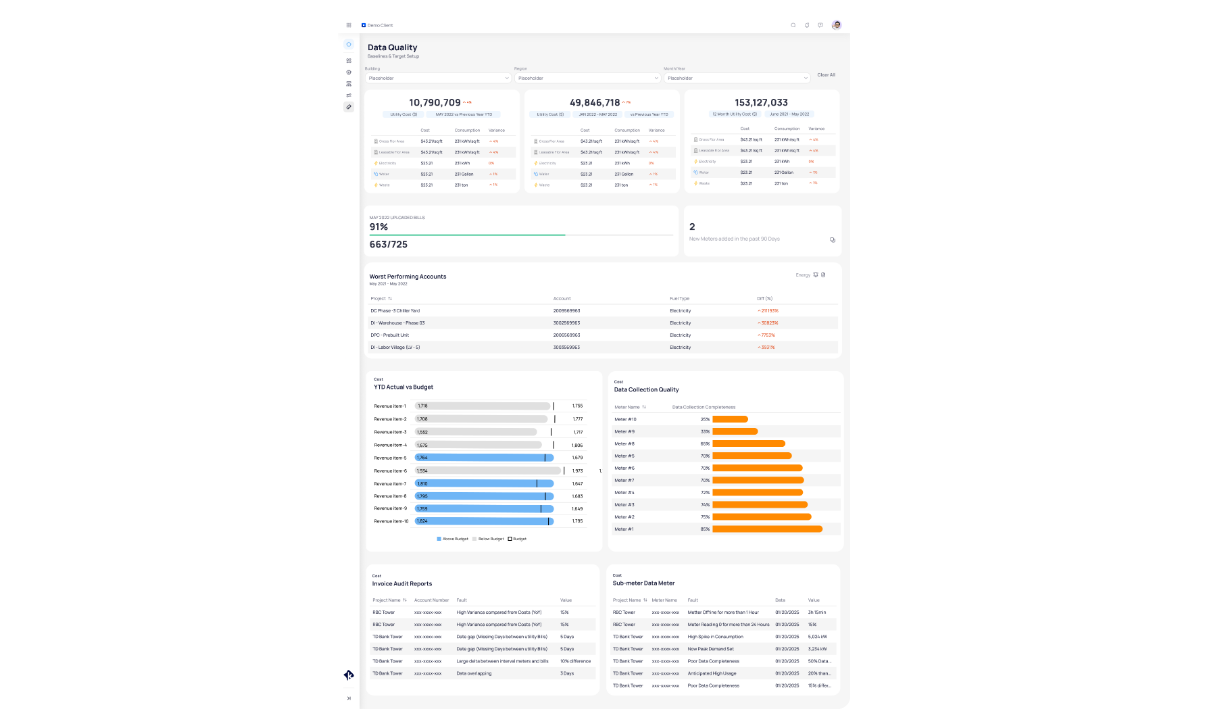
Before any analytics or reporting begins, data quality is ensured. KODE OS applies:
This isn’t just cleanup, it’s foundational to accurate reporting and robust measurement & verification (M&V).
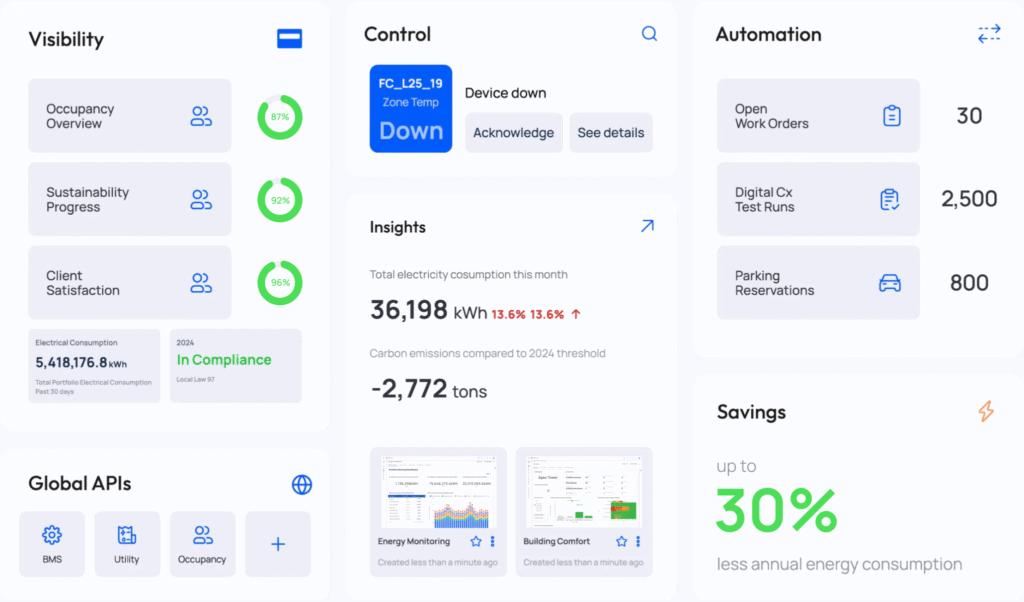
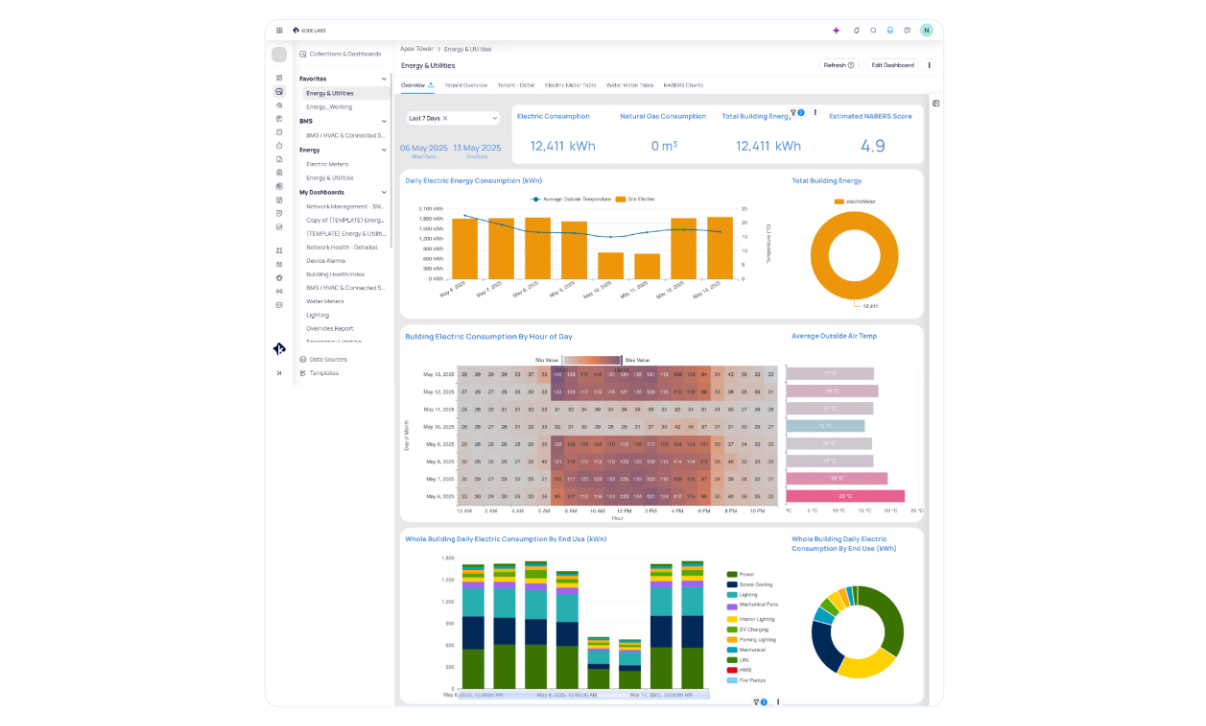
Once your data is centralized and validated, KODE OS enables you to track, analyze, and disclose performance with confidence.
KODE OS includes pre-configured KPIs such as:
These are tailored to align with leading reporting standards and can be broken down by building, meter, tenant, or portfolio level.
Within KODE OS, teams can generate:
Data can be sliced, visualized, and exported for direct input into CDP, GRESB, or internal sustainability reports.
Sustainability is not just about tracking the past, it’s about planning the future. The Decarbonization module further supports capital planning by linking building audits to forecasted improvements in emissions and energy savings, essential for setting and tracking net-zero strategies.
Utilizing ASHRAE Level 1 audit data or your own Energy Conservation Measures (ECMs), the platform enables:
Aggregated views allow sustainability teams and executives to:
Whether you’re evaluating retrofit ROI or mapping out a carbon budget, the Decarb module brings clarity to complex capital planning.
One of the greatest advantages KODE OS brings to sustainability teams is credibility. In a landscape where ESG claims are under increasing scrutiny, the ability to back every figure with verified, real-time data becomes a strategic differentiator.
KODE OS ensure your reporting is:
With KODE OS, your ESG reports move beyond regulatory checkboxes. They become a powerful reflection of your progress, priorities, and performance. It’s the confidence you need to communicate your impact to stakeholders, investors, and the public.
While ESG compliance is a highly important goal, the insights provided by KODE OS also help deliver real world performance improvements by:
KODE OS enables cross functional alignment between Sustainability, Operations, and Finance, all working from a single source of truth.
Collecting data is one thing, doing something meaningful with it is another. Too often, sustainability teams are stuck managing fragmented systems and chasing down numbers that should already be at their fingertips.
KODE OS brings it all together, turning raw data into structured insights, and reporting into a process you can rely on. With everything in one place, you get the clarity to track progress, the tools to take action, and the confidence to report it.
Ready to experience how EnerG and KODE OS would impact your organization? Reach out to our team today.
______________________________________________________________
EnerG is KODE’s AI-enabled utility management platform, purpose-built to make utility data more accessible, manageable, and actionable. It automates utility data collection and consolidates it into a single source of truth, giving sustainability, finance, and operations teams a unified view of energy, water, carbon, and cost performance across their entire portfolio.
Powered by an AI-driven Alert Center, EnerG automatically detects anomalies, flags billing discrepancies, and maintains a complete audit trail to support compliance and reporting readiness. EnerG is built to support your journey to net zero by streamlining critical workflows, identifying reduction opportunities, and tracking progress with confidence.
Available as a standalone solution or fully integrated with KODE OS, EnerG delivers audit-ready ESG, investor, and regulatory reporting at scale.
KODE Team
News, insights and resources from the world of smart building management.
By clicking "Sign Up" you're confirming that you agree with our Terms and Conditions.
“Isn’t this just another utility reporting tool?” It’s the first question almost every Energy or Sustainability leader asks when EnerG…
Read more
In 2026, every corporate real estate team faces the same question: Do we still need all this office? Answering it…
Read more
What does Fault Detection & Diagnostics do? For building integrators, every truck roll has a cost. A technician sent out…
Read more