On this page
Subscribe to receive the latest blog posts to your inbox every week.
By subscribing you agree to with our Privacy Policy.
For building integrators, every truck roll has a cost. A technician sent out for a minor issue is lost time. A technician sent out for no real issue is worse. The hard part has never been a lack of data. Building systems generate plenty of it. The hard part is using that data to validate performance and find the real problem first.
That’s exactly where Fault Detection & Diagnostics in KODE OS earns its place in an integrator’s workflow.
FDD continuously monitors equipment and point data across the building. From there, it turns that constant stream into clear, prioritized, actionable signals. As a result, integrators can validate system performance remotely and find the issue from the platform. Ultimately, you understand the likely root cause before sending anyone on location.
That changes how integrators operate. Your team implements some fixes remotely, with no dispatch at all. And when a technician is needed, they roll out already knowing what’s wrong. They know why it happened and what to bring before they arrive. This cuts wasted trips and saves labor hours. You resolve issues faster and keep a transparent record of what your team found and did.
The FDD platform is designed around how teams actriage and resolve building issues, moving from detection to diagnosis to resolution without leaving the platform. Here’s how you can use it:
Ultimately, the result is a faster, more consistent response process, from the moment a fault appears to the moment it’s resolved.
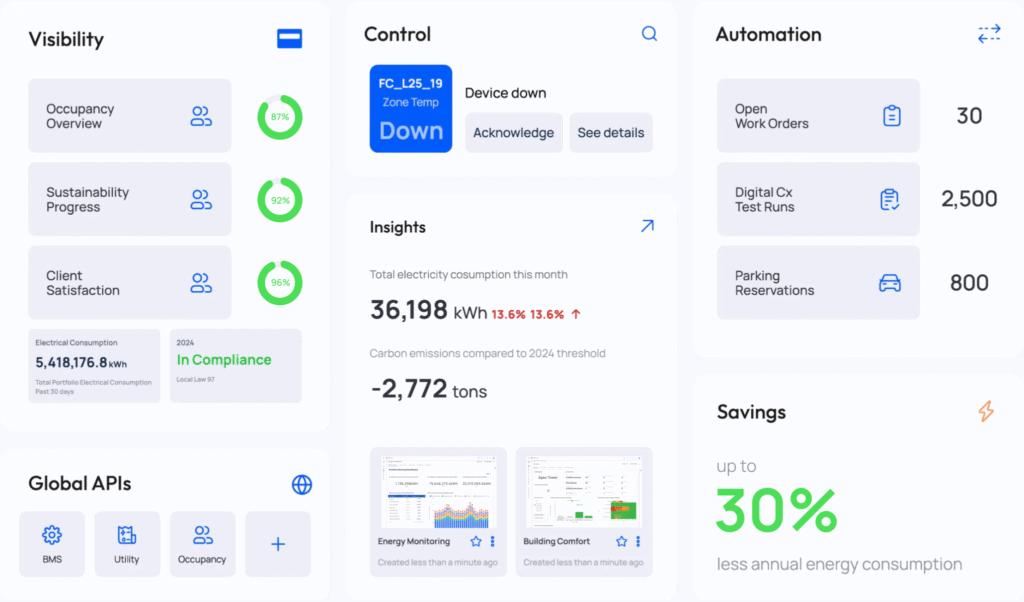
First, the FDD platform shows you every active event in your building, centralized in one place.
Teams get an immediate, real-time picture of what’s happening across their equipment. No checking multiple systems. No waiting for a complaint to surface the problem.
From there, the priority filter at the top lets you focus. Select a priority level, such as all warnings, and the list automatically filters down to just those events. That makes it easy to separate the issues that need attention now from the noise, and to work through faults in a deliberate, prioritized order.
For integrators managing complex buildings, that single prioritized view is what keeps a flood of alarms from becoming unmanageable.
Then, when you click into a fault, KODE OS shows a trend of the exact point value that triggered it.
This matters because diagnosis usually starts with a question: what actually went wrong? Instead of digging through raw point histories to reconstruct the event, the trend puts the triggering data front and center.
That context shortens the path from ‘something is wrong’ to ‘here’s what’s wrong and why.’ That’s exactly where most troubleshooting time is lost.
Alongside each fault, KODE OS gives teams everything they need to move from diagnosis to action without switching platforms:
Ultimately, this keeps diagnosis, documentation, and dispatch in one continuous workflow, instead of scattered across email threads, spreadsheets, and separate systems.
Each fault also includes an AI Suggestion tab.
Here, KODE OS’s generative AI analyzes the fault and returns a clear breakdown. You get a statement of the problem, the likely root causes, and recommended next steps.
For example, for less experienced technicians, this provides expert-level guidance on the spot. Meanwhile, for seasoned operators, it’s a fast second opinion that confirms a hunch or surfaces a cause they hadn’t considered. Either way, it compresses the time between detecting a fault and knowing how to fix it.
Next, the Assignees tab is where FDD becomes a team workflow.
You can add assignees to a fault and choose how they’re notified, by text message, email, or phone call, based on the fault. When an assignee acknowledges a fault, the team sees a clear line between what’s handled and what still needs attention.
Still, that acknowledgment step is deceptively important. It’s what lets a team triage at scale, ensuring nothing slips through the cracks and no two people unknowingly chase the same issue.
Finally, the Historical tab keeps a record of your faults over time and lets you run analytics across multiple months of issues.
Instead of treating each fault as a one-off, teams can see patterns. Think equipment that fails repeatedly, recurring seasonal issues, or systems that quietly generate more faults than they should. Those actionable analytics turn day-to-day firefighting into longer-term operational improvement.
Most tools either detect faults or help manage work orders. FDD in KODE OS connects the entire response loop, from detection to diagnosis to dispatch to long-term analysis, in one platform.
As a result, that difference changes how teams operate:
For building integrators, FDD provides the visibility and tools to catch issues early, respond fast, and keep systems running effectively. The workflow stays consistent enough to scale across a portfolio, building after building.
From real-time fault visibility to AI-assisted diagnosis and historical analytics, this is what staying ahead of building issues looks like in KODE OS.
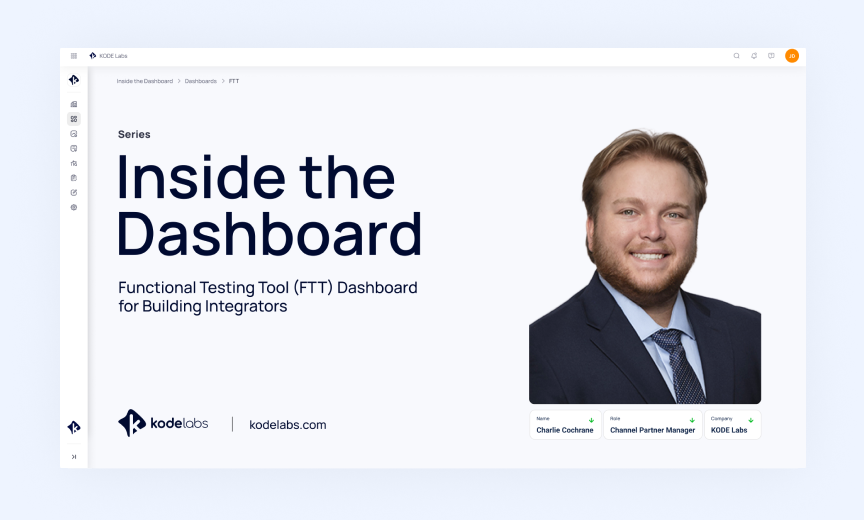
In this edition of Inside the Dashboard, Charlie Cochrane walks through the full workflow. Teams detect faults, diagnose root causes, route issues to the right people, and learn from months of fault history, all from one platform
If you want to explore how FDD would work across your buildings, let’s connect on LinkedIn or book a demo with our team.
News, insights and resources from the world of smart building management.
By clicking "Sign Up" you're confirming that you agree with our Terms and Conditions.
What does the Functional Testing Tool do? For building integrators, functional testing becomes difficult at scale. Testing one fan coil…
Read more
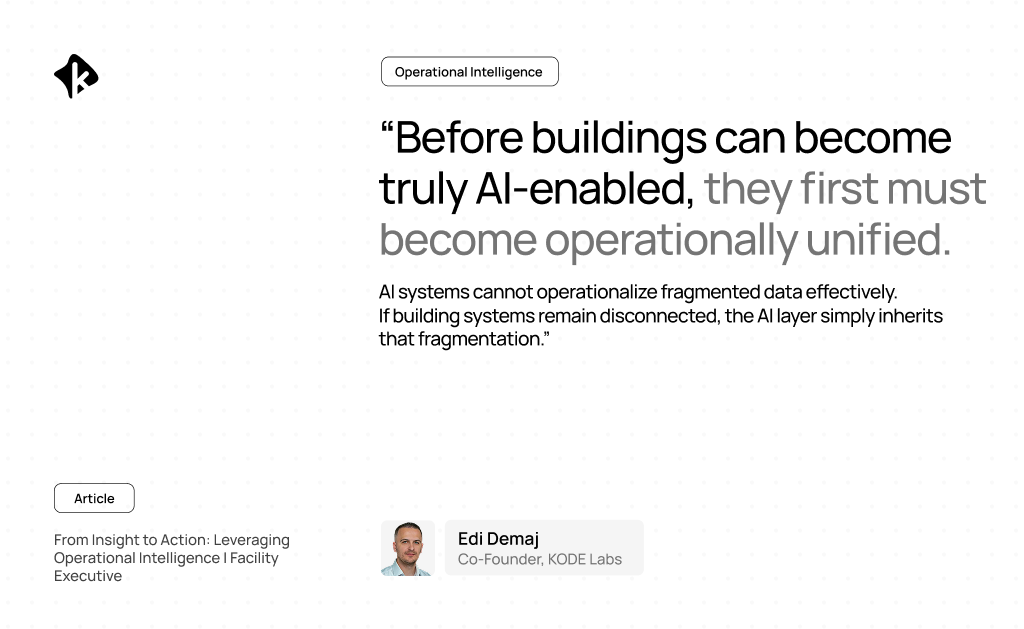
Originally published on Facility Executive The next phase of facility management relies on unified data streams to optimize building performance,…
Read more
June strengthens the KODE OS integration ecosystem with a new governed Public API for AssetOps and expanded connectivity for physical…
Read more