On this page
Subscribe to receive the latest blog posts to your inbox every week.
By subscribing you agree to with our Privacy Policy.
September was about closing the gap between seeing and acting.
Operational teams aren’t short on signals.
Faults surface in FDD. Alarms come from access control and building automation. Meter readings arrive from smart meters, manual rounds, and utility portals. Compliance data lives in ENERGY STAR Portfolio Manager. And the cameras watching the building often sit in yet another system.
The challenge is getting from signal to action without losing time, or data, along the way.
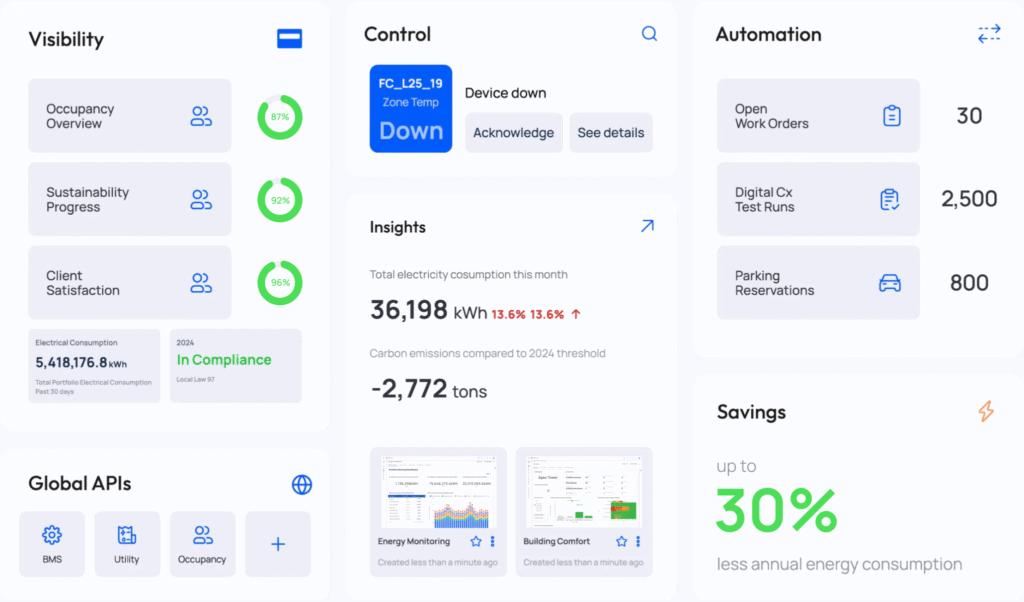
September introduces a set of KODE OS enhancements designed to shorten that path: surfacing issues the moment they happen, turning a triage session into dispatched work in a single pass, keeping meter and sustainability data consistent wherever it lives, and bringing more of the building into one view.
Here’s what shipped, grouped around the outcomes it delivers.
Not every meter is connected. Many teams still walk the building, read the display, and log the number by hand, or calculate consumption for the month from a utility bill.
KODE OS now brings manual meters in line with the point model smart meters already use. Every new manual meter is created with two points by default: an accumulator point for the actual reading shown on the meter display, and a differential point for calculated consumption over a period, such as daily, weekly, or monthly totals.
When adding a reading, users simply choose which type they’re entering, and the value is stored on the matching point. Everything else about the reading workflow stays the same.
Manual readings remain available across trends, dashboards, exports, and API access, just like any other meter data.
Manual data shouldn’t be second-class data.
Whether a technician logs the meter display or an analyst enters a monthly consumption total, the value now lands in the right place, structured the same way as connected meter data. That means fewer workarounds, cleaner comparisons between manual and smart meters, and more confidence in the consumption figures that feed reporting and analysis.
For teams monitoring fault detection and diagnostics as it happens, a static table isn’t enough.
The new FDD Stream Mode gives operators a dedicated, full-page view designed for active monitoring. New events are inserted into the table automatically as they occur, no refreshing, no manual interaction.
Newly arrived rows flash briefly so they’re easy to spot, and events less than a minute old carry a “Just Now” badge beneath their start time. Any filters applied before entering Stream Mode stay active, so operators can watch only the buildings, equipment, or fault types they’re responsible for.
To keep the stream truly real time, sorting is locked to Most Recent so new events always arrive at the top, and priority-level event counts are left out of this view.
When something fails, the minutes between detection and awareness matter.
Stream Mode turns FDD into a live operations feed for control rooms and monitoring teams, so new faults are noticed as they appear rather than discovered at the next refresh.
Building BI is extending beyond charts and metrics into live operational monitoring.
A new Camera Widget lets users add a live camera feed directly from the widget library to any dashboard. Feeds are connected and configured like any other widget, and they resize and reposition the same way, so a camera view can sit right next to the occupancy, energy, or equipment data it relates to.
When a feed is unavailable, clear offline and error states let users know immediately.
Data tells you something has changed. Video often tells you why.
Combining live visuals with operational metrics gives teams one dashboard for both, reducing the need to switch between separate camera-monitoring tools and BI, and adding real-time context to the decisions dashboards are built to support.
Until now, turning events into work orders happened one event at a time: one event, one dialog, one submission.
The Events list now includes a + Work Orders per Event action that creates an individual work order for every selected event, building on the same multi-select pattern teams already use to bulk-acknowledge events.
Operators select events, then review the full set in a single submission dialog that shows each item’s readiness, To Be Completed when the work order is auto-populated and ready to send, or Draft when it needs attention. Events can be removed from the batch without starting over.
From there, teams can submit everything at once or choose Review Each to step through every work order in the standard form, moving between events with simple batch navigation.
After submission, a clear outcome summary shows which work orders were sent and which weren’t. If some fail, Review Unsent takes operators straight back to just the failed items to fix and resubmit, without touching what already succeeded. Every created work order also feeds the existing Generated Work Orders view.
Work order creation becomes part of the triage session, not a separate task after it.
Operators make one pass over the event list, make one set of decisions, and dispatch once. And because every item has a clear sent or unsent status, a partial failure no longer means guessing what made it through—or redoing the whole batch.
For many portfolio teams, ENERGY STAR Portfolio Manager (ESPM) is where compliance happens, but it’s rarely where operational data is managed. The result is often double entry, or decisions made on stale data with no clear view of whether the two systems agree.
EnerG now offers a unified ESPM connection with bi-directional sync. ESPM remains the compliance destination, while EnerG serves as the operational source of truth for vetted meter data, with explicit rules for what flows in each direction, when, and who can override.
With a single connection, teams can:
Portfolio teams can stop double-entering ENERGY STAR data.
Trusted usage and scores flow to ESPM, ESPM updates flow back, and sync health and job history are visible and auditable. Before GRESB submissions or investor reporting, ESG teams have a single place to confirm that EnerG and ESPM agree.
September also expands KODE OS connectivity across access control and security, metering, maintenance management, and building automation.
Kastle — Access Control & Security
Bring card access events and security alarms into KODE OS for centralized visibility into allowed and denied access, credential-holder and location details, and alarm status.
Veolia — Metering
Monitor electric meter status, cumulative energy usage, and demand, and use historical reads to analyze consumption and demand trends across portfolios.
MaintainX — CMMS / EAM
Connect asset status, current meter readings, and work orders, including status, priority, location, and assignee—with the broader operational environment.
As security, energy, maintenance, and building automation systems become part of the same data environment, teams gain more context for investigation, reporting, and increasingly connected operational workflows.
→ Read the September Integrations Drop for the complete breakdown.
September’s releases reinforce a simple idea:
Seeing a problem should lead directly to doing something about it.
Operators can watch faults arrive in real time, view live camera feeds alongside operational data, and turn a full triage session into dispatched work orders in a single pass.
Energy and sustainability teams can capture manual meter data with the same structure as connected meters, and keep EnerG and ENERGY STAR Portfolio Manager aligned without double entry.
And new integrations bring access control, metering, maintenance, and building automation data into the same operational layer.
The result is an operating environment where less time is spent moving between systems, and more is spent acting on what they reveal.
September was about closing the gap between seeing and acting.
Across fault detection, maintenance, energy data, sustainability reporting, and connectivity, this month’s releases help teams notice sooner, respond faster, and keep their data consistent wherever it needs to go.
See it sooner. Act on it faster. Trust it everywhere.
News, insights and resources from the world of smart building management.
By clicking "Sign Up" you're confirming that you agree with our Terms and Conditions.
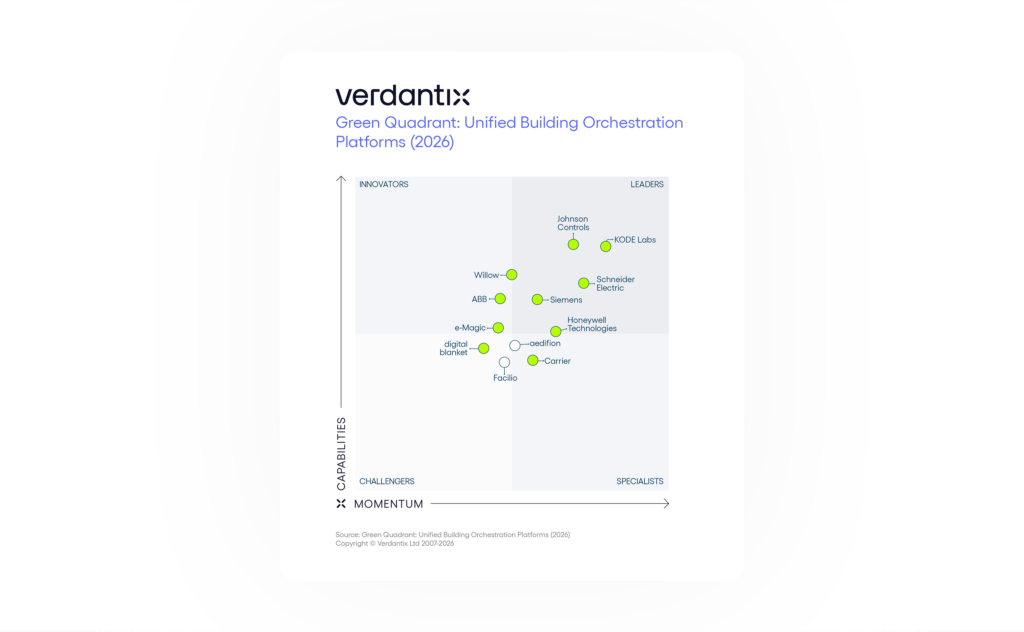
Independent research recognizes KODE OS as the building operating system connecting fragmented systems, data and workflows across complex real estate…
Read more
More systems connected. Faster paths from data to action. September expands the KODE OS integration ecosystem across building automation, access…
Read more
DETROIT, Michigan — August 05, 2026 — KODE Labs, the company building the intelligence infrastructure for the physical world, today…
Read more