By KODE Team
On this page
Subscribe to receive the latest blog posts to your inbox every week.
By subscribing you agree to with our Privacy Policy.
Hybrid work has settled into the norm and return-to-office mandates have largely plateaued, yet the office still isn’t full. Underused space isn’t a temporary blip. The built environment has carried a quiet crisis of underutilization for over a decade, and it is now colliding with rising occupancy costs, aggressive real-estate targets, and pressure to run leaner.
If you run corporate real estate or workplace, none of that is news. You see the empty desks every day. The harder question is the one your CFO eventually asks: how much of floor 14 did we actually use last quarter, and can you prove it? For most teams the answer is no, because the data exists in too many places that do not agree. And a number you cannot defend is a number you cannot act on.
That is what this guide is really about. Not that space is underused, which you know, but how to turn scattered occupancy data into one number you can stand behind and use. It starts with the question every real-estate owner is trying to answer:
How much space do I really need?
Benchmarks have tightened sharply. Where 200-plus square feet per person was once standard, JLL’s 2025 planning benchmarks point toward roughly 132 sq ft per person, and most hybrid offices now plan a desk-to-employee ratio near 0.7:1, about 70 desks for every 100 employees for teams in two to three days a week. Improving utilization is not about cramming people in. It is about sizing to real demand and reinvesting the difference. For multi-site owners, that starts with leveraging occupancy sensors to right-size the portfolio before optimizing any single floor.
Getting to a defensible answer takes the right strategy. Here are three steps to build one.
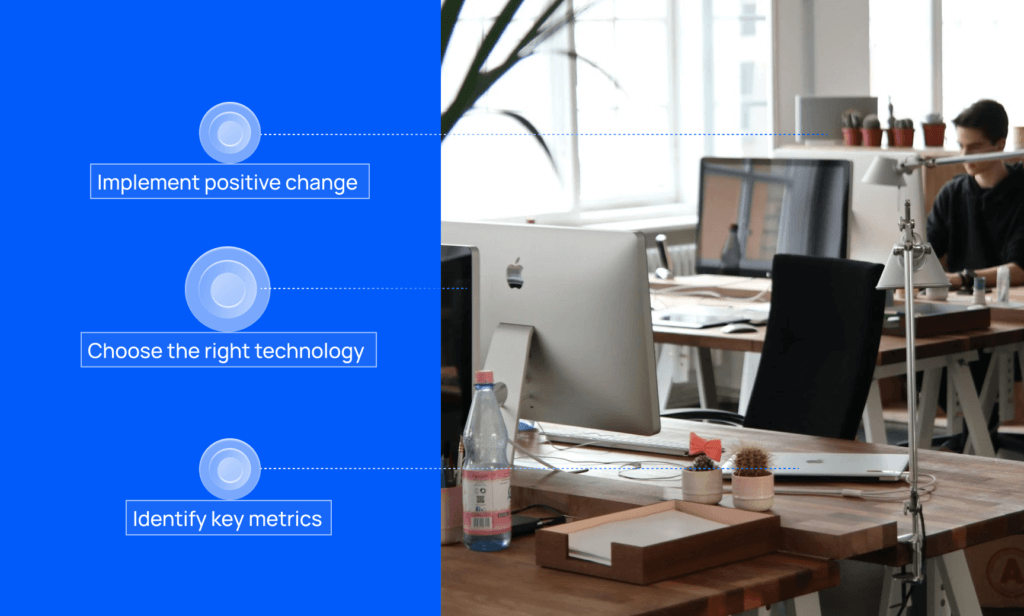
The right metrics turn a vague sense that the office is quiet into decisions you can back with evidence. Three matter most, and each answers a different question.
Occupancy and vacancy data. This counts how many people move through your facility or a specific area, usually expressed as the number of people present over time. It tells you your average load day to day and week to week, which is the baseline for every other decision. It answers “how busy is this space?”
Utilization level data. This compares actual usage to designed capacity, expressed as a percentage over time. Occupancy tells you 80 people were on the floor; utilization tells you the floor was built for 200, so it ran at 40%. This is the number your CFO and your landlord care about, because it maps directly to cost per seat and to how much space you can release.
Density data. This measures how tightly a space is used: employee density in an area over time. It is a strong indicator of efficiency, but it cuts both ways. Push density too high, and you trade cost savings for crowding, thermostat complaints, and rising CO2, which is why the best teams read density next to comfort rather than in isolation.
Captured together, these three give you an objective picture instead of an anecdotal one, and most organizations find their perception was well off from reality once they see what their occupancy data reveals.
Takeaway: Occupancy tells you who is present, utilization tells you against what, and density tells you at what cost to experience.
There are many ways to capture these metrics. Before choosing, answer three questions: how often do you need the data, what is your budget, and what is the reporting for – a one-time redesign or ongoing space management? Your answers point to one of three common approaches.
| Approach | How it works | Best for |
|---|---|---|
| Occupancy sensors and people counters | Dedicated sensors count people entering and exiting for anonymous, accurate counts. | New, precise counts in key zones. |
| Access control, Wi-Fi, and camera data | Badge logs, network data, and camera add-ons infer occupancy from systems you already run. | Building-level trends with no new hardware. |
| Building-system software overlay | A platform ingests, normalizes, and displays data from all your existing systems on one screen. | Portfolio-wide visibility that also connects to HVAC, lighting, and comfort. |
Here is the catch most “utilization projects” hit. Each of these systems measures something different. Badge counts entries, not who is still in the building at 3 p.m. Wi-Fi counts devices, and people carry two or three. Room and desk booking counts reservations, not whether anyone showed up. Sensors are accurate but usually cover only some zones. The BMS sees equipment, not how a space gets used. Ask three systems for your utilization number and you get three answers, so every stakeholder quotes the one that supports their case.
Adding a sixth source does not fix that. Connecting the ones you already have does. A building-system software overlay reconciles these feeds by space and time into one number everyone can trust, and then surfaces it as the views you would actually use.
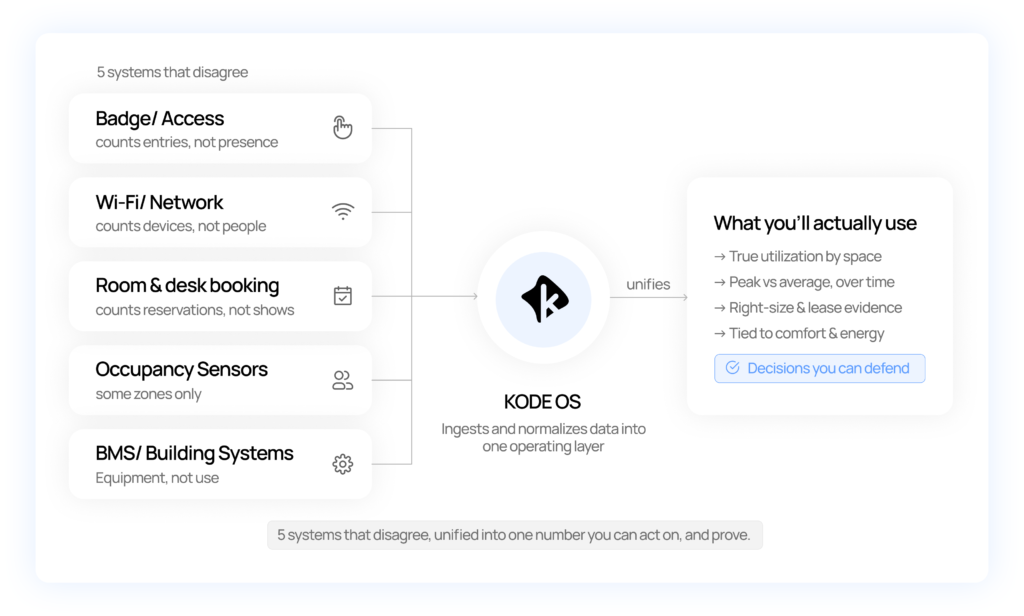
This is where KODE OS fits. It ingests and normalizes data from your badge, Wi-Fi, booking, sensor, and building systems without new hardware, and because it runs as one operating layer the same trusted occupancy data also powers workspace utilization across your portfolio, buildings, and spaces. The Guardian Building in Detroit is a clear example: rather than replacing legacy systems, KODE OS brought them together in one cloud platform, and with occupancy informing HVAC schedules the building cut energy 9% in its first month.
The technology question is not “which sensor,” it is “what unifies everything I already have into one number.”
When the utilization number cannot be defended, four expensive things happen.
For the person who signs the lease, that is cost per square foot and sublease exposure you cannot quantify. For the workplace leader, it is employee experience you cannot demonstrate. The root cause is the same: no trusted number.
An untrusted number hurts most at the lease table and in the RTO debate, the two rooms you can least afford to enter blind.
A trusted number is only useful if you do something with it. Once occupancy is gathered and reconciled, these moves return the most space and the most goodwill.
Eliminate ghost bookings and right-size meeting rooms. The mismatch is stark. 60% of meetings are small, one to six people, yet rooms average only about 28% of their capacity, and no-shows and ghost bookings leave 30-45% of booked minutes unused, an estimated $40K-plus per floor each year. Auto-releasing no-show rooms and rebalancing toward smaller rooms and focus spaces recovers real estate quickly.
Adopt neighborhoods and flexible seating. Hoteling, activity-based neighborhoods, and desk booking let you run a 0.7:1 desk ratio without leaving people without a seat on peak days. This is the modern successor to older mobility strategies, now backed by real booking and occupancy analytics rather than a one-time study.
Size to peak-day attendance, not the roster. Set desks to your busiest day plus a 10-20% growth buffer, then build focus, meeting, and break space around it. Sizing to the roster is how you end up paying for a Tuesday-Wednesday office five days a week.
For the person who signs the lease, this is where a defensible number pays off. Walk into a renewal or a sublease decision with reconciled utilization, cost per square foot, and quantified exposure on space you carry but do not use, and you negotiate from evidence instead of instinct. Time the changes to your lease events, and show the before-and-after so the decision holds up under scrutiny.
Just as important, do not shrink at the cost of experience. Over-consolidate and you recreate the exact problems that empty an office. The teams that get this right connect occupancy with comfort and building performance, pairing utilization with operational intelligence for the hybrid workplace and continuous comfort and air-quality monitoring so a smaller office is still one people want to use.
Once the number holds up, the decisions it unlocks are the whole point.
Track a small, defensible set, ideally rolled up across the portfolio.
KODE OS reports workspace utilization by portfolio, buildings, and space type from one reconciled source, surfaces peak-day and busiest-day patterns, breaks out desk and meeting-room usage, and ties occupancy to energy and to zones out of setpoint. Pair that reconciled utilization with your own lease and cost data, and the cost-per-seat and sublease-exposure figures fall out of the same view.
Improving office space utilization is not about being told the office is underused. You know that. It is about the three steps that turn that knowledge into action: measure the right metrics, unify the systems you already have into one number you can trust, and act on it to right-size, cut waste, and defend the decision. Do that and office space shifts from a cost you explain to a decision you drive. If you want to see how intelligent, connected utilization data can transform your footprint, book a demo with our team.
What is a good office space utilization rate? There is no single number, but many organizations aim for peak-day utilization around 80% while keeping average weekly utilization healthy. The point is to size desks to peak demand, not the roster.
How do you calculate office space utilization? Divide the space actually used by its designed capacity over a period of time, for example average people present divided by seats, tracked across the week so a one-off peak does not skew the picture.
Why do our occupancy systems give different numbers? Because they measure different things. Badge counts entries, Wi-Fi counts devices, booking counts reservations, sensors cover some zones, and the BMS sees equipment. None of them alone equals utilization, so they have to be reconciled into one source of truth.
What is a single source of truth for space utilization? One reconciled number per space and time period, normalized and deduplicated across all your occupancy systems, so every stakeholder is working from the same figure.
How much office space do you need per employee in 2025? Benchmarks have tightened toward roughly 132 to 175 square feet per person, with hybrid desk ratios near 0.7:1 for teams in two to three days a week.
Do you need new sensors to measure utilization? Usually not. Most buildings already generate plenty of occupancy signal through access control, Wi-Fi, and building systems. A software overlay like KODE OS normalizes that existing data rather than adding hardware.
How do you prove a workplace change actually worked? With a clean before-and-after from one trusted source: utilization, plus the comfort and energy it is connected to, over comparable periods.
How does utilization data help at a lease negotiation? It gives you defensible utilization and cost-per-square-foot evidence, plus quantified sublease exposure, so you right-size and negotiate from data instead of instinct.
How does space utilization relate to energy and comfort? Occupancy data can drive HVAC and lighting schedules and explain comfort issues. Connecting the two is how the Guardian Building cut energy 9% in a month while keeping conditions in range.
Is this only for large portfolios? No. A single HQ benefits, and the value compounds across a portfolio because the same reconciled number rolls up across buildings and spaces.

KODE Team
News, insights and resources from the world of smart building management.
By clicking "Sign Up" you're confirming that you agree with our Terms and Conditions.

Originally published on Leadership Today To redesign work for AI, leaders have to look beyond adding new technology to existing jobs…
Read more

For commercial real estate owners, utility costs are easy to think of as a monthly expense to reconcile, report and…
Read more
August was about making scale easier. As portfolios grow, operational complexity grows with them. More maintenance work needs to be…
Read more