By KODE Team
On this page
Subscribe to receive the latest blog posts to your inbox every week.
By subscribing you agree to with our Privacy Policy.
For an Energy and Sustainability Manager, the day does not start with strategy.
It starts with pressure.
A utility spike at one site. Missing data in another. A reporting deadline that is getting closer. A carbon target that leadership wants updated. A budget variance that finance needs explained. And behind all of it, the same underlying question:
Can we trust the data enough to act on it?
That question has become harder to answer across large portfolios. Utility data is still scattered across portals, PDFs, spreadsheets, tenant billing files, and disconnected systems. Building performance data often lives somewhere else. Budgets, targets, and certifications sit in separate workflows. So even before decisions can be made, someone has to reconcile the story.
That is the cycle EnerG was built to break.
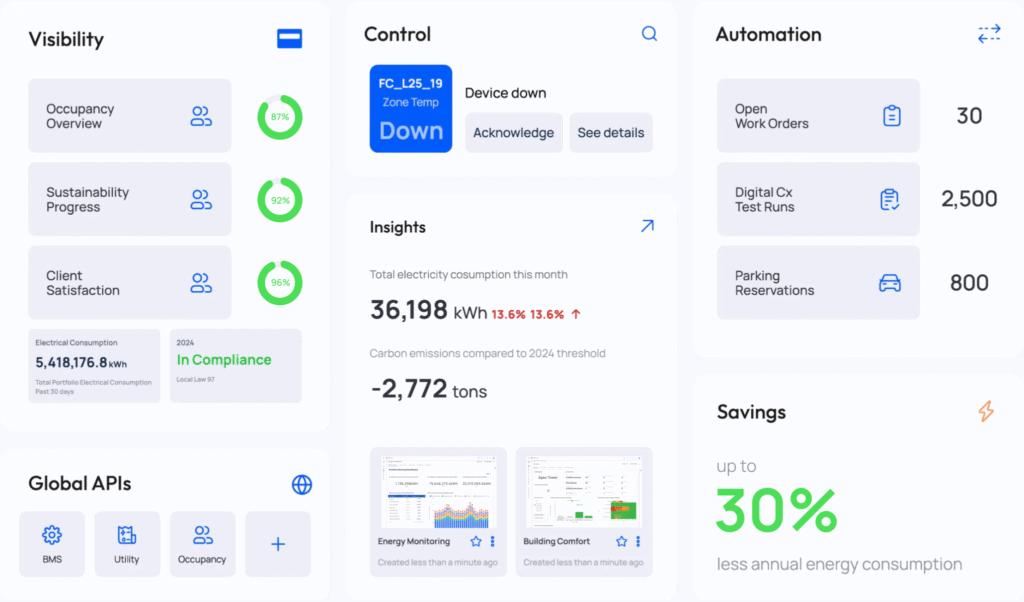
When deployed alongside KODE OS, EnerG gives Energy and Sustainability Managers more than utility data management. It creates a connected workflow across utility intelligence, building performance, carbon tracking, reporting, and planning so teams can move from collecting data to using it.
The first task is not building a report. It is knowing whether the underlying data is complete, accurate, and usable.
Instead of logging into portals or checking spreadsheets line by line, the Energy and Sustainability Manager starts in EnerG, where utility and sustainability data has already been centralized from bills, portals, PDFs, APIs, SFTP, tenant billing, and metering systems.
From there, problems surface quickly.
Missing records. Duplicate bills. Overlapping periods. Gaps in data. Billing issues. Variances between billed consumption and meter data.
Instead of finding those issues at the end of the month or during reporting, they are flagged early through EnerG’s Alert Center, with a visible audit trail that shows what happened, what was reviewed, and what was resolved.
That changes the job immediately.
The day no longer starts with manual cleanup. It starts with clarity on what actually needs attention.
Once the data is validated, the Energy and Sustainability Manager can actually use it.
EnerG makes it possible to benchmark energy, water, carbon, and cost across the portfolio without first spending hours normalizing files manually. Buildings can be compared consistently. Historical performance can be reviewed cleanly. Outliers become visible faster.
One site is trending above expected energy use. Another is drifting from the target. A third shows billing patterns that do not align with interval data.
Now the role shifts from data collection to performance analysis.
Instead of spending the morning assembling reports, the Energy and Sustainability Manager can focus on where the portfolio is underperforming, where costs are rising, and where action is worth taking.
This is where the day moves beyond utility management.
EnerG shows what is happening across cost, consumption, and carbon. KODE OS helps explain why.
By connecting utility intelligence to building operations, the Energy and Sustainability Manager can go deeper into performance across sites, floors, systems, and end uses. They can review demand curves, hourly usage patterns, peak demand periods, working versus non-working hour consumption, meter-level trends, and carbon performance across the building.
That matters because utility data alone does not tell the full story.
A rise in off-hours usage may point to a scheduling issue. Peak demand may reveal an operational pattern that can be optimized. A floor consuming more than expected may indicate a controls issue, a tenant behavior pattern, or a system running outside intended conditions.
Without this operational layer, the team can see the symptom but not the driver. With KODE OS, energy intelligence becomes something they can act on.
This is where many sustainability workflows start breaking down.
Targets live in one place. Budget assumptions live in another. Capital plans sit in another deck. And too often, none of them are tied back to the same validated data.
EnerG helps close that gap.
Targets can be created and tracked across the portfolio. Utility performance can be compared against baselines, budgets, and expected trends. Variances can be investigated earlier. Scenario modeling helps teams evaluate what operational changes, efficiency measures, or capital projects are likely to impact both cost and carbon.
So the Energy and Sustainability Manager is not just reporting on performance. They are helping shape the plan behind it.
Which sites should be prioritized first? Where is there a measurable opportunity to reduce waste? Which buildings are likely to create future compliance risk? Which initiatives support both decarbonization goals and financial reality?
These are better decisions when utility, energy, carbon, and budget data are not fragmented across separate tools and teams.
Reporting pressure is constant.
GRESB. CDP. ENERGY STAR. Local compliance requirements. Internal board updates. Investor questions. Certification deadlines.
For many teams, these cycles still trigger the same routine: chase the missing bills, reconcile inconsistencies, update spreadsheets, explain changes, repeat.
EnerG is built to reduce that friction.
Because the data is centralized, validated, and organized in one auditable workflow, reporting becomes less about chasing inputs and more about preparing submissions with confidence. Certification management, structured data validation, portfolio benchmarking, and reporting readiness help reduce the manual work that usually turns each cycle into a fire drill.
The responsibility does not go away. But the fragility does.
By the end of the day, the job is not to present a chart. It’s to walk in with clarity.
Leadership wants to understand whether the portfolio is improving, where cost exposure is growing, what carbon risks are building, and what actions should happen next. That takes more than a utility summary.
It requires trusted data, portfolio context, operational visibility, and a clear link between building performance and business impact.
With EnerG and KODE OS together, the Energy and ESG Manager can show:
That is a very different position from simply reporting consumption after the fact.
The role of the Energy and Sustainability Manager is only getting more demanding. More scrutiny, reporting pressure, and more expectation to connect sustainability performance with operational and financial reality.
What breaks most teams is not effort. It is weak infrastructure.
EnerG was built to centralize, validate, and activate utility and sustainability data at a portfolio scale. KODE OS extends that value by connecting energy intelligence to building systems, operational patterns, and action.
Together, they help Energy and Sustainability Managers move through the day with fewer manual handoffs, earlier visibility into issues, stronger reporting confidence, and a clearer path from energy data to building performance improvement.
Because the goal is not just to report what happened.
But to understand it, manage it, and improve it across the portfolio.
Book a demo to see how EnerG and KODE OS connect utility intelligence to building performance, optimization, and decarbonization action.
KODE Team
News, insights and resources from the world of smart building management.
By clicking "Sign Up" you're confirming that you agree with our Terms and Conditions.

Smart building transformation doesn’t happen through technology alone. It requires teams that can coordinate across functions, solve complex challenges, and…
Read more

Walk the floor at any CRE technology conference this year, and the booths blur together. AI. Single pane of glass.…
Read more
May expands the KODE OS integration ecosystem with new integrations, operational workflow upgrades, and enhanced historical data recovery capabilities, improving…
Read more