On this page
Subscribe to receive the latest blog posts to your inbox every week.
By subscribing you agree to with our Privacy Policy.
For commercial real estate owners, utility costs are easy to think of as a monthly expense to reconcile, report and move on from. Across a large portfolio however, the picture is more complicated. The distance between utility spend and utility savings is where most of the recoverable money sits.
Utility cost appears in operating budgets, monthly variance reports, annual forecasts, and ultimately in the expenses that determine Net Operating Income (NOI).
A higher electricity bill may reflect greater consumption. It can also mean a rate change, an unusual billing period, a meter issue, weather, occupancy, or a change in how the building runs. Across a large portfolio, where utilities, meters, accounts, tariffs and data sources vary from one property to the next, understanding those differences becomes difficult surprisingly quickly.
That creates a gap between knowing what the portfolio spent and knowing where the team can actually move the number.
EnerG closes that gap. It brings utility bills, interval meter data, cost, sustainability information, budgets and portfolio performance into one environment. Owners get a reliable way to see how utility performance affects the financial performance of their assets.
Utilities are part of the operating expense base used to calculate Net Operating Income. When an owner reduces a utility expense it is responsible for, while property revenue remains unchanged, that reduction can contribute directly to higher NOI.
The harder part is establishing where the saving came from, whether it was real, and whether it will continue. That takes reliable utility data and a credible baseline. It also takes enough context to tell an actual improvement from a billing change, a weather event, a temporary operating condition or a data problem.
At a glance:
Utility costs sit at the intersection of several parts of the real estate organization.
Energy and sustainability teams may focus on consumption, demand, intensity, emissions and meter performance. Finance teams look at actual spend, budget variance and forecast accuracy. Asset managers are thinking about operating expenses and NOI, while building operators are trying to understand whether something happening inside the asset is driving the change.
A higher utility bill does not automatically mean a building is operating inefficiently. Electricity rates, weather and occupancy all move independently of how well the building itself is performing, and so do tariff structures and utility charges.
At the same time, real utility savings do sit in the portfolio. Equipment may be operating longer than necessary. A property may be consuming more than comparable assets. A billing issue may be creating unnecessary spend. An operational condition can go unnoticed because a much larger portfolio total hides its impact.
For owners, the useful questions are narrower. How much of the movement can the team explain, how much of it can they change, and where does intervention pay for itself? That requires more context than the utility bill alone can provide.
Large portfolios rarely suffer from a lack of utility information. The difficulty is organizing it consistently enough to support meaningful analysis.
Bills may arrive from dozens of providers. Interval data can come from several meter systems. Properties operate under different account structures, tariffs, currencies, billing periods and utility types.
Before that information can support a savings calculation, teams need confidence that the underlying record is complete.
A missing bill can make consumption appear artificially low. Two overlapping billing periods can make a property look unexpectedly expensive. Incorrect account mappings or incomplete meter data can distort comparisons before the analysis has even started.
EnerG closes each of those gaps before anyone calculates a saving. Accruals estimate usage or cost for months without a final bill, borrowing prior-year shapes and calendarizing them to the current period, so a month-end gap doesn’t read as an improvement. A calendarized view spreads billing-period usage across calendar months by average daily consumption, so a 34-day cycle doesn’t read as a consumption increase. Data completeness scoring and the Alert Center flag missing reads, overlaps, duplicates and late or missing bills at the account and meter level. Meter comparison sets check utility bills against interval reads, which is how billing errors surface instead of quietly inflating OpEx.
Once the data is reliable, the conversation becomes more useful. If a property is running 8% above budget, the immediate conclusion should not be that it has an efficiency problem.
Teams can first ask whether consumption increased, whether rates changed, whether one account is carrying the whole variance. They can also check whether comparable properties show the same pattern. Each of those checks narrows what the team is actually looking for.
Consider a property that begins running materially above its utility budget. On the surface the problem looks simple: the building is costing more than expected. But the number alone does not tell the asset team what to do next.
EnerG can bring the relevant billing, account, meter and cost information together. That shows when the variance began, how large it is, and whether it consumption moved with it. .
The analysis may show that part of the increase came from a rate change, while another portion came from higher electricity use.
The rate increase may be largely outside the building team’s control. The consumption increase gives the team something specific to investigate.
If the pattern suggests the issue originates inside the building, the investigation can extend into KODE OS.
The team can examine the same period alongside building system data, looking at equipment behavior, schedules, setpoints and faults. The cause is often mundane. An HVAC schedule ran further into unoccupied hours, or a fault raised runtime without creating an immediate comfort complaint.
EnerG establishes what changed at the utility and cost level. Building data can help explain why it changed when the cause is operational.
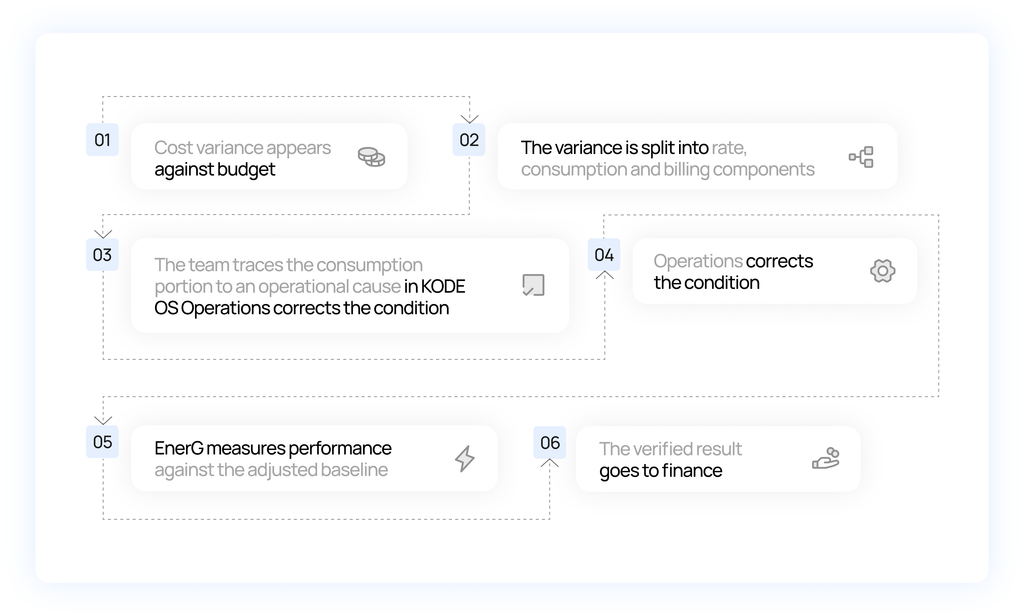
Once the team fixes the underlying condition, later utility performance shows whether the expected improvement occurred. Measure it against a weather-normalized baseline rather than last year’s raw bill. EnerG’s M&V models use adjusted baselines and align with IPMVP Option B where metering isolation supports it, and Option C where whole-building billing data represents performance.
That is a far stronger financial story than reporting that the system caught an energy anomaly. The team can follow the whole path:
Energy-management programs can produce long lists of possible utility savings.
Those estimates are useful because they help teams prioritize where to spend time and resources. Nobody should book them as realized utility savings. If an analysis suggests that correcting a condition could save $50,000, that number still represents potential value. Someone has to confirm the issue and act on it first.
The same discipline applies afterward.
A lower-cost month does not prove the intervention created the improvement. Temperature, occupancy and utility rates all move on their own. The organization needs enough context to tell whether the expense changed because of the action it took. Weather normalization and adjusted baseline are what supply it.
This distinction matters most when the conversation reaches asset managers and CFOs.
A number the system believes it could save is not enough. They need enough evidence to understand what changed in operating expense and whether that improvement is likely to persist. Estimated savings help prioritize opportunities. Verified savings support a financial case.
| Identified saving | Verified saving | |
|---|---|---|
| What it is | An opportunity with an estimated value | A measured change in cost or consumption |
| Basis | Anomalies, benchmarks, faults | Post-period performance against an adjusted baseline |
| Weather and rate adjustment | Not applied | Applied |
| Who accepts it | Energy and sustainability teams | Finance, asset management, auditors |
| Used for | Prioritizing where to spend time | Budgets, forecasts, NOI, ESG disclosure |
The relationship between operating expense and NOI is relatively straightforward. Revenue holds, an owner-borne operating expense falls, and more income remains once expenses come off.
Take a property spending $1 million per year on utilities that removes $100,000 of unnecessary owner-borne expense. That reduction contributes $100,000 to NOI, assuming revenue and other operating expenses remain unchanged.
The step worth adding is what happens next. Buyers value income-producing property off NOI, so a reduction that persists capitalizes into value.
| Effect | |
|---|---|
| Utility expense | Down $100,000 |
| NOI | Up $100,000 |
| Value at a 6% cap rate | Up roughly $1.67M |
| Value at an 8% cap rate | Up roughly $1.25M |
The arithmetic is illustrative and assumes the saving persists, with revenue and other operating expenses unchanged.
The real-world relationship is not always that simple. Under a gross lease the landlord carries utility costs and the reduction reaches NOI directly. Under net and triple-net structures, tenants reimburse some or all of those expenses through CAM or expense recoveries. A reduction in gross expense then lowers recovery income alongside it. Net effect on owner economics depends on the recovery ratio at that property.
Nobody should call a utility saving a dollar-for-dollar increase in NOI without first checking how that property treats the expense.
Even where utility expenses are recoverable, lower costs still matter. They reduce total occupancy costs, which helps at renewal in a soft leasing market. They also limit exposure to rising rates. Commercial electricity averaged 14.19 cents per kWh in June 2026, up 4.8% on the year (EIA, 2026), and that increase lands on the property whether or not anything inside it changed. Lower consumption feeds emissions targets that now carry filing deadlines, and a falling gross-up figure makes a building easier to lease against comparable stock.
EnerG connects utility performance with cost, budgets, and portfolio context rather than leaving energy data in a separate reporting exercise.
At one building, a team can review a bill, investigate an unusual meter and spend time understanding the variance manually.
Across a portfolio containing hundreds or thousands of utility accounts, that approach does not scale. The challenge becomes knowing which buildings deserve attention in the first place.
If a portfolio contains 200 properties, the energy team should not have to investigate all 200 with the same level of effort every month.
It should be able to identify the smaller group of buildings where consumption, cost or budget performance has moved far enough from expectations to justify an hour of someone’s time. That turns the search for utility savings from a reporting exercise into an exception-management model.
A few thousand dollars of unnecessary spend at one property may not receive much attention. If the same issue appears across 40 or 50 buildings, the financial impact becomes much more significant.
Portfolio-level analysis can also reveal patterns that individual buildings cannot. One property may consistently use more energy than comparable assets. Several accounts may show the same billing issue. A group of buildings may be moving away from budget for the same reason.
This is where EnerG moves beyond utility reporting. Centralizing and validating utility information across the portfolio gives energy, asset, sustainability and finance teams one common view of consumption and cost.
Utility reporting has traditionally been backward-looking. A billing period ends, someone collects the data, someone assembles the reports, and the team explains what happened. A more useful model brings utility performance closer to the decisions being made about the asset.
When actual cost moves away from budget, teams should be able to understand what is driving the variance. Then when one property begins behaving differently from its peers, the issue should be visible before it becomes buried in a quarterly review. When an intervention should reduce cost, later utility data should show whether the improvement reached the meter, and then the financial performance of the property.
EnerG provides the utility intelligence needed to support that process. It centralizes and validates the underlying data, surfaces the accounts that deserve attention, and creates a consistent way to move from consumption to cost. When a variance points back to the building, KODE OS can provide the operational context required to investigate the cause.
Utility savings reach NOI through a chain that has to hold at every link. A complete billing record, a weather-normalized baseline, a variance you can attribute, an operational cause you can fix, and a measured result afterward. If you are building the financial case for utility work across a portfolio, start with the NOI model rather than the energy data.
Book a Demo | Explore the Platform
When utilities are an operating expense borne by the property owner, a sustained reduction in that cost improves NOI if revenue and other expenses remain unchanged. At a stated cap rate, that NOI increase also raises the asset’s value.
Yes. Under a gross lease the owner keeps the full reduction. Under net and triple-net structures, tenant recoveries fall alongside the gross expense, so the net effect depends on the property’s recovery ratio.
An identified saving is an opportunity or estimated financial impact. A verified saving carries evidence that the cost or consumption actually changed after the action, and that the improvement held.
Weather-normalized baselines adjust for heating and cooling conditions. Variance analysis then splits the movement into rate and consumption components. Without both, a lower bill proves nothing.
EnerG flags abnormal consumption, cost variances, billing discrepancies, and missing or duplicate data. It also compares performance across similar properties, so investigation goes to the accounts and meters where action may produce financial value.
EnerG primarily provides utility intelligence rather than acting as a standalone building-control system. Deployed alongside KODE OS, utility anomalies connect with building-system and equipment data so operators can investigate and address operational causes.
Yes. EnerG is available as a standalone utility intelligence solution. Connected with KODE OS, the same utility and cost information sits alongside building systems, asset performance and operational workflows.
EnerG is KODE Labs’ AI-powered utility intelligence platform for enterprise real estate. It centralizes utility bills, interval meter data, sustainability information, cost and related portfolio data into a trusted system of record. Capabilities include AI-assisted ingestion, validation, anomaly detection, budgeting, variance analysis, planning and reporting.
News, insights and resources from the world of smart building management.
By clicking "Sign Up" you're confirming that you agree with our Terms and Conditions.
August was about making scale easier. As portfolios grow, operational complexity grows with them. More maintenance work needs to be…
Read more
More systems connected. More building context in one place. August expands the KODE OS integration ecosystem across building automation, access…
Read more

Corporate real estate teams now connect more systems and have access to more building data than ever. Dashboards can surface…
Read more