By Clay Curlee
On this page
Subscribe to receive the latest blog posts to your inbox every week.
By subscribing you agree to with our Privacy Policy.
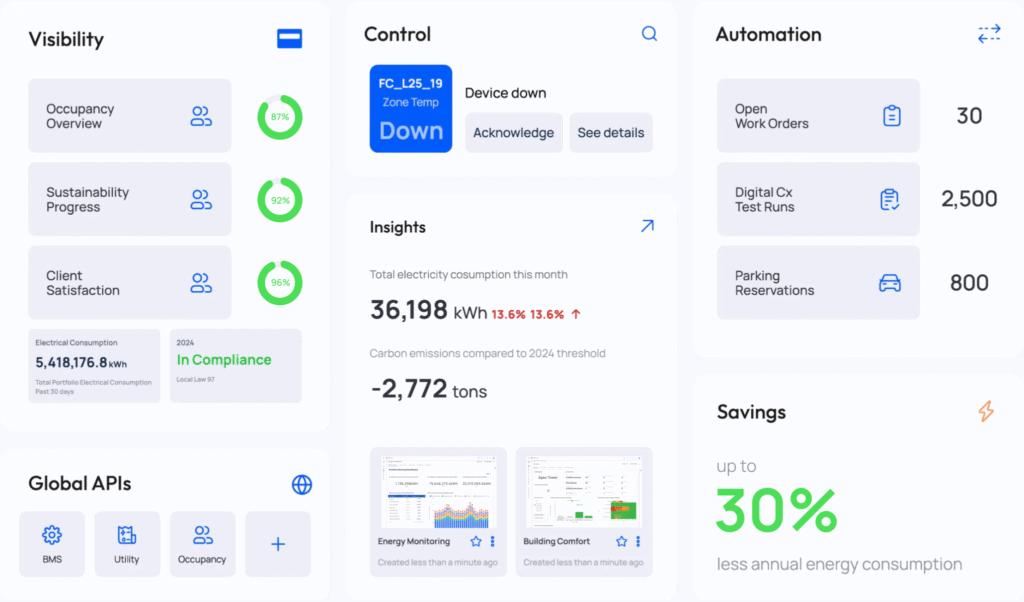
The Workspace Occupancy & Utilization dashboard provides a unified view of how space is actually used across portfolios, buildings, and individual spaces.
Most organizations already have occupancy data, but it’s fragmented across different systems: sensor pilots, access control, Wi-Fi triangulation, and booking tools. Each source tells part of the story, but none of them align. As a result, teams struggle to trust the data, benchmark performance, or act on it.
KODE takes a different approach.
Instead of replacing systems, it connects to existing infrastructure, including access control, camera-based people counting, and over 30 types of occupancy sensors, then normalizes that data into a consistent model, creating a single, trusted view of utilization across the portfolio.
By analyzing portfolio trends and space-level behavior, teams identify what’s overused, underused, and where demand is shifting, without replacing existing systems.
The WorkspaceOccupancy & Utilization dashboard turns fragmented data into clear, comparable insights across your portfolio. Here’s how you can use it:
The result is a consistent and reliable view of workspace usage across all locations, enabling more precise planning and execution.
A core capability of the Workspace Occupancy & Utilization dashboard is its ability to standardize data across multiple systems without requiring rip-and-replace.
KODE integrates with:
It normalizes this data into a single structure, enabling consistent comparison of utilization across buildings, floors, and space types.
For example:
This ensures that all teams are working from the same, reliable dataset.
The dashboard provides a structured view of utilization across multiple levels:
This layered approach allows teams to move from high-level strategy to detailed operational insights within a single system.
Workspace utilization data is only useful if teams can interpret it quickly.
KODE dashboards are fully customizable, including:
This allows each team, from workplace to operations to leadership, to view the data in a format that matches how they work.
The Workspace Occupancy & Utilization dashboard supports multiple stakeholders across the organization:
For CRE teams:
Supports portfolio decisions such as consolidation, lease strategy, and capital planning based on consistent utilization data.
For workplace teams:
Aligns space design with actual usage patterns, improving employee experience and reducing underutilized areas.
For facilities teams:
Enables demand-based operations by aligning services such as cleaning, HVAC, and energy use with actual occupancy patterns.
For executives:
Provides a measurable view of workspace performance in terms of cost, efficiency, and return on investment.
By standardizing data across systems, all teams operate from the same standardized dataset, eliminating inconsistencies across reports.
Most solutions aggregate utilization data. KODE standardizes it.
That difference removes the need to reconcile conflicting data sources and reduces the cost of implementation by leveraging existing infrastructure.
Instead, teams gain a clear, consistent, and scalable view of workspace utilization across the entire portfolio.
From portfolio trends to detailed space-level behavior, the Workspace Occupancy & Utilization dashboard provides the visibility needed to understand what’s working and what needs to change.
In this edition of Inside the Dashboard, we walk through how teams are using Workspace Occupancy & Utilization to identify inefficiencies, improve space performance, and align operations with actual demand.
If you want to explore how this would apply to your portfolio, let’s connect on LinkedIn or book a demo with our team.
Clay Curlee
Account Executive, KODE Labs
News, insights and resources from the world of smart building management.
By clicking "Sign Up" you're confirming that you agree with our Terms and Conditions.
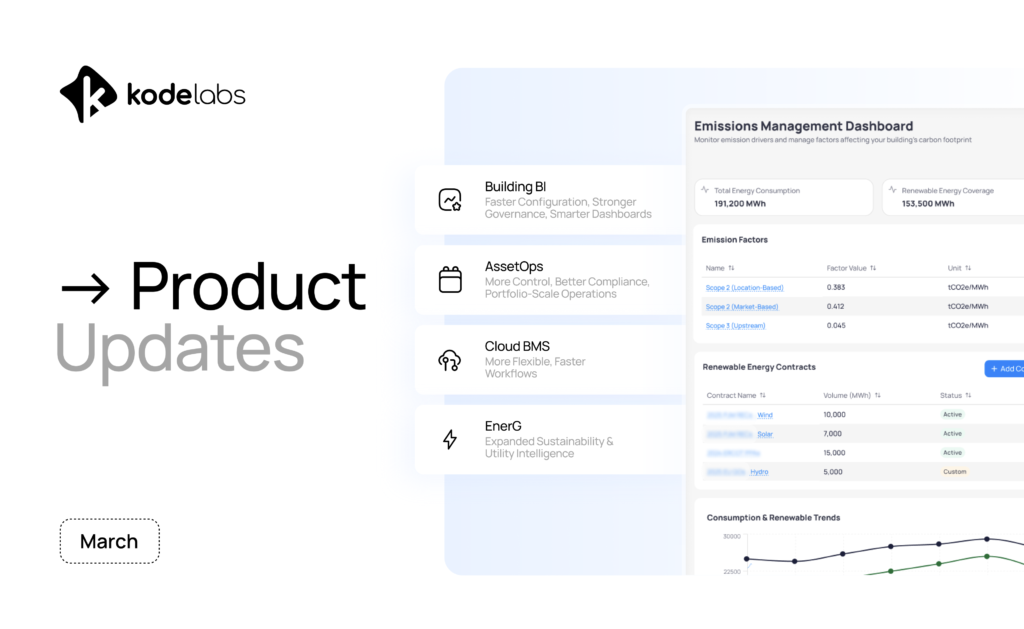
March at KODE was all about scale, control, and visibility. This month, we focused on making KODE OS easier to…
Read more
March expands the KODE OS integration ecosystem with new systems and updates, increasing visibility across security, energy, maintenance, and workplace…
Read more

Reporting season doesn’t wait for your data to be ready. Utility data management for ESG reporting has become a critical…
Read more