By Clay Curlee
On this page
Subscribe to receive the latest blog posts to your inbox every week.
By subscribing you agree to with our Privacy Policy.
It’s the first question almost every Energy or Sustainability leader asks when EnerG enters the conversation. And it’s a fair one. Most enterprises have already invested in something that touches utility data, a bill payment platform, a sustainability portal, a spreadsheet a long-tenured analyst built five years ago, a reporting tool bolted onto an accounting system.
But the question itself is the problem. Utility intelligence isn’t about reporting on bills. It’s about turning utility data into a financial asset that shapes budgets, capital plans, and compliance outcomes. The gap between those two postures is already showing up in P&Ls.
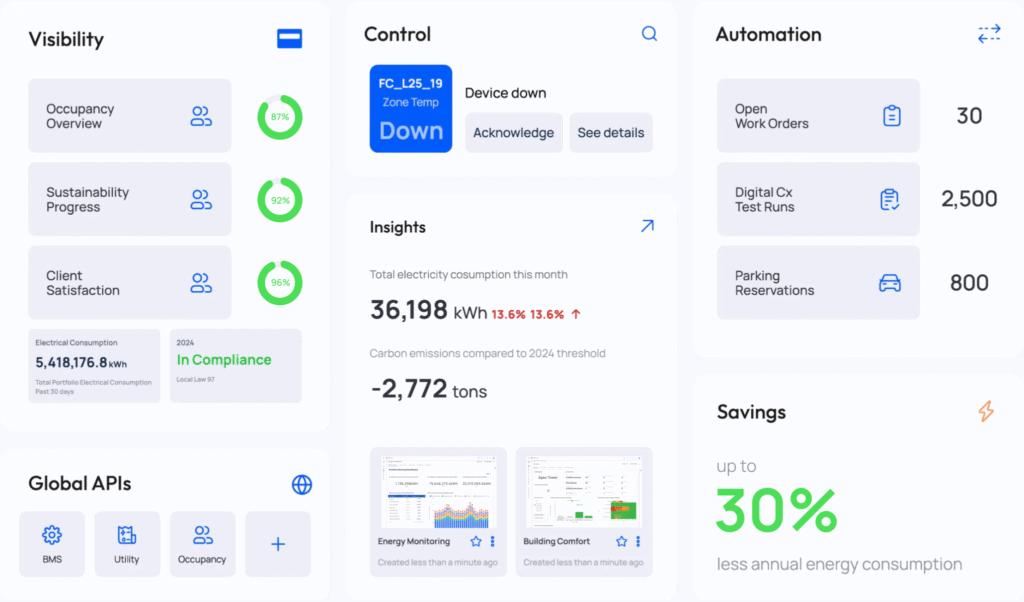
Utility intelligence is the layer that turns fragmented utility data, such as bills, meters, consumption, and rates, into a validated, normalized source of truth that finance, real estate, and sustainability teams can rely on. When done well, it converts one of the largest controllable operating expenses in real estate into a defensible input for budgeting, capital planning, and audit-ready compliance.
In fact, walk into most enterprises and ask where utility data lives, and you’ll get a list, not an answer. Bills sit scattered across portals from a dozen different providers. Some are in PDFs on shared drives. Others sit in spreadsheets that a regional manager maintains. Sustainability data lives somewhere else entirely. Capital planning lives in a third place.
As a result, none of these systems talk to each other. After all, they evolved separately, on different timelines, to solve different problems. And the result is a strange paradox: enterprises spend enormous amounts on energy every year, but very few can answer basic questions about that spending with confidence.
Meanwhile, the bill is climbing fast. U.S. electric and gas utilities requested nearly $31 billion in rate increases in 2025, more than double that of 2024. In addition, commercial customers have seen retail electricity prices rise 25% since 2021. When a controllable cost is moving that fast, “we already see the numbers” stops being good enough.
So the questions energy leaders ask, rather than being sustainability questions, turn into financial ones:
These questions are hard to answer, not because the data doesn’t exist, but because no one has structured, validated, or connected the data to anything that drives a decision.
Ultimately, that’s the actual problem: the absence of utility intelligence.
A utility bill, on its own, is a record of a transaction that already happened. Useful for accounting, almost nothing else.
Utility data becomes financially valuable when four things are true:
When utility data meets these four conditions, it stops being a backward-looking record and starts becoming forward-looking intelligence. It can support better planning, stronger investment decisions, and more defensible reporting across the organization.
Insert diagram: data flow from utility portals → validation → normalized portfolio view → connected to budgeting, capital planning, and ESG outputs.
Four shifts tend to make the biggest difference:
Typically, most teams interact with their utility data once a month, when bills come in. By the time anyone notices a spike, two more billing cycles have passed. With utility intelligence, you catch variances within days. When a meter misbehaves, the system flags it before it becomes a six-figure problem.
Building-by-building reporting is where most organizations are stuck. Moreover, each site has its own story, its own quirks. However, roll it up, and the picture gets blurry. In contrast, portfolio-wide benchmarking changes the conversation. When you measure every building a normalized standard, outliers become obvious. In fact, the worst-performing 10% of sites usually drive a disproportionate share of cost and emissions.
Which assets are oldest and most expensive to operate? Where would a chiller swap or envelope upgrade produce the highest return? Without trusted utility data, teams answer these questions without evidence. With it, decarbonization plans stop being a wishlist and become a sequenced, ROI-ranked capital strategy a board can approve.
Indeed, voluntary ESG reporting is over. Therefore, regulators, lenders, insurers, and major customers now ask for the trail behind the numbers. (We covered the reporting side of this in depth in our piece on utility data management for ESG reporting.) Audit-ready compliance means every report traces back to its source, the system logs every adjustment, and reporting stays continuous rather than an annual fire drill.
A category distinction worth getting right:
| Criteria | Utility bill management | Utility intelligence |
|---|---|---|
| Primary purpose | Pay bills accurately and on time | Use validated data to drive decisions |
| Owned by | AP / finance ops | Energy, sustainability, finance, real estate |
| Output | Paid invoices, GL coding | Forecasts, capital plans, ESG reports, benchmarks |
| Time horizon | Backward-looking | Forward-looking |
| Best for | Reducing late fees and AP burden | Reducing total cost and de-risking compliance |
Takeaway: Bill management is a transaction layer. Utility intelligence is the decision layer that finance, ESG, and real estate all draw from.
EnerG is built specifically for the shift this article describes. It centralizes utility bill management, validates and standardizes incoming data, runs completeness and anomaly checks, calendarizes usage, maintains a full audit trail, and syncs with ENERGY STAR Portfolio Manager.
It supports the work most enterprises currently do across half a dozen disconnected systems, budgeting, benchmarking, capital planning, and sustainability reporting, and brings it under one structured, validated source of truth.
That positioning was recognized at Realcomm IBcon 2026, where EnerG won the Digie Award for Best Tech Innovation in the Intelligent Buildings category.
EnerG works as a standalone platform across offices, industrial sites, retail, and any asset class with a meter. It also pairs with KODE OS for organizations that want to connect utility intelligence to real-time building operations.
EnerG represents the next evolution of KODE OS, expanding our ontology to unify utility, sustainability, operational, and financial data into a single system of record. When data is fragmented across portals and disconnected SaaS tools, AI can’t deliver real results.
By enabling the EnerG module into KODE OS, we’re enabling clients to eliminate redundant point solutions, consolidate their stack, and activate AI across their portfolios. EnerG turns utility data from a reporting burden into a strategic advantage.
Etrit Demaj, Co-Founder at KODE Labs
Read the full launch releaseUtility spend is one of the largest controllable operating costs in a real estate portfolio. Yet the data behind it is often treated like an afterthought. When bills, usage, rates, budgets, and building performance are fragmented across systems, organizations lose the ability to see what is really happening across their portfolio.
Instead, the opportunity is not simply to report on utility costs more efficiently. Rather, it is to turn utility data into utility intelligence, a trusted source of insight that supports sharper budgeting, stronger capital planning, and audit-ready compliance.
In the end, a utility bill tells you what happened last month. Utility intelligence helps you understand what needs to happen next.
Book an EnerG demo to see what your portfolio looks like with validated, normalized utility data behind every decision.
Utility intelligence is the layer that turns raw utility bill and consumption data into a centralized, validated, normalized source of truth that finance, sustainability, and real estate teams can use to make decisions, not just to record what was spent.
Bill management focuses on paying invoices accurately and on time. Utility intelligence focuses on what the data tells you once it’s validated: how to budget, where to invest capital, and how to defend ESG numbers under audit.
Raw consumption numbers aren’t comparable across buildings. Weather, occupancy, square footage, and billing periods all distort the picture. Normalization is what makes a portfolio view meaningful and what makes the data trustworthy for finance.
Energy budgets stop being last year’s number plus an inflation guess. Forecasts are built from validated consumption trends, normalized for weather and operations, with variance tracked in real time so finance gets numbers they can defend.
It surfaces which buildings and systems are driving disproportionate cost and emissions, so capital flows toward upgrades that will actually move the numbers. Decarbonization plans stop being a wishlist and become a sequenced, ROI-ranked strategy.
It usually starts with energy or sustainability, but the value is unlocked when finance, real estate, and operations all draw from the same source. Shared ownership is the point.
Clay Curlee
Account Executive, KODE Labs
News, insights and resources from the world of smart building management.
By clicking "Sign Up" you're confirming that you agree with our Terms and Conditions.
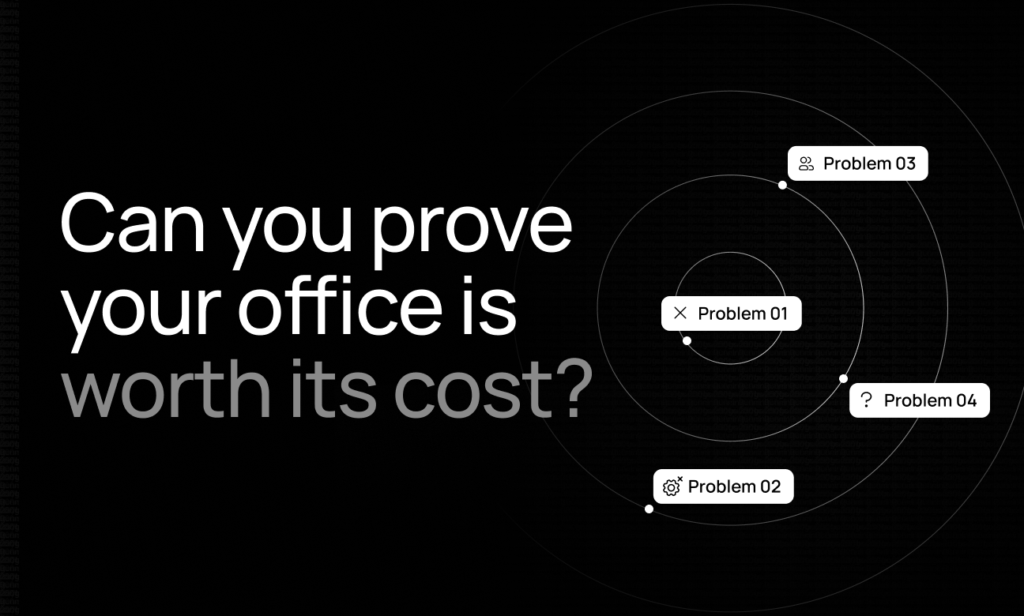
In 2026, every corporate real estate team faces the same question: Do we still need all this office? Answering it…
Read more
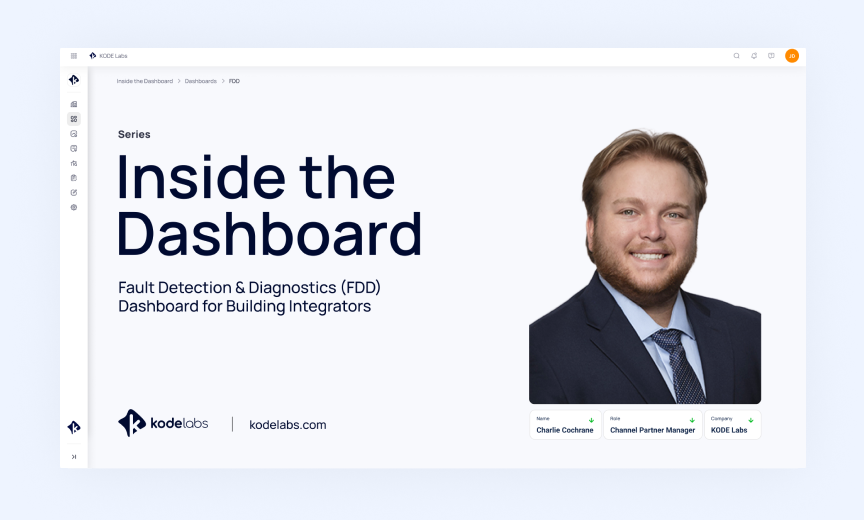
What does Fault Detection & Diagnostics do? For building integrators, every truck roll has a cost. A technician sent out…
Read more

Smart building transformation doesn’t happen through technology alone. It requires teams that can coordinate across functions, solve complex challenges, and…
Read more