On this page
Subscribe to receive the latest blog posts to your inbox every week.
By subscribing you agree to with our Privacy Policy.
In 2026, every corporate real estate team faces the same question: Do we still need all this office? Answering it well comes down to one thing: office space utilization data, clear enough to act on.
The hybrid-work debate has cooled. Meanwhile, the real-estate-cost debate has not. Leases are coming up for renewal. Budgets are tightening. And leadership wants a number that says, plainly, whether the office is earning its cost or it isn’t.
Most companies can’t produce that number. The problem isn’t too little data, but too much of it, scattered across too many places. Badge swipes from access control say one thing. Wi-Fi data from IT says another. The room booking platform tells a third story. A sensor pilot covers one building. As a result, none of it reconciles, and nobody trusts a single source. The figure on the board slide ends up a best guess wrapped in a chart.
This isn’t a measurement problem. It’s a strategy problem hiding inside a data problem. In fact, corporate real estate teams will spend the next 18 months solving it, whether they want to or not.
When leadership asks for proof, the instinct is to assume you need a fleet of new sensors first. However, you usually don’t.
Most occupiers already hold the inputs that matter. These include access control and badge data, Wi-Fi data, room booking systems, workplace apps, facilities and work order records, and whatever sensors a pilot left behind. The gap isn’t collection. Instead, these sources live in separate systems, owned by separate teams and measured in different ways. They’re never assembled into one picture.
This is where operational intelligence becomes the difference. It connects existing systems and standardizes the data into one model. As a result, raw data points become dashboards and KPIs. Finally, finance, facilities, workplace, and real estate all work from metrics they trust.
Corporate real estate leaders, facilities teams, workplace strategists, and finance departments all need answers to different questions. How much space is actually being utilized? Which buildings are underperforming? Where are energy costs rising faster than occupancy? Without a unified view, every team builds its own reports and produces competing versions of the truth.
This is where building intelligence platforms become increasingly important. It starts with a centralized building data hub and a business intelligence layer. From there, you standardize metrics, automate reporting, and deliver role-specific dashboards. As a result, you move from reporting what happened to understanding why it happened, and what to do next.
The work is consolidation, not acquisition. Instead of buying more, unify the systems you have into a single view and run your analytics off one consistent story. Then you can answer most of what leadership is asking, without spending a dollar on new hardware.
Naturally, executives tend to want one utilization percentage. A single number is easy to put on a slide and almost always misleading.
A building that averages 50% can be half-empty on Mondays and packed on Wednesdays. Same average, completely different problem. Instead, the useful questions are when, where, and why: day-of-week patterns, floor-by-floor occupancy, and workspace utilization across portfolios, buildings, and individual spaces. They also expose the gap between peak and average demand.
Those patterns drive the real decisions. For example: which floors to consolidate, where to redesign, how to place amenities, and how much capacity the next lease needs. The average tells you none of it.
Unfortunately, occupancy alone is an incomplete metric, and acting on it in isolation gets teams into trouble.
A floor running at 30% occupancy might be underused and ready to give back. Or it might be one of your best spaces: quiet, comfortable, used exactly as intended for focused work. Occupancy alone can’t tell you which. To know, you have to connect it to other signals. These include air quality, comfort, energy performance, maintenance trends, employee experience, and the space’s intended purpose.
In short, that’s the shift that matters: from measuring occupancy to measuring workplace effectiveness. The first tells you how many people showed up. The second tells you whether the space is doing its job.
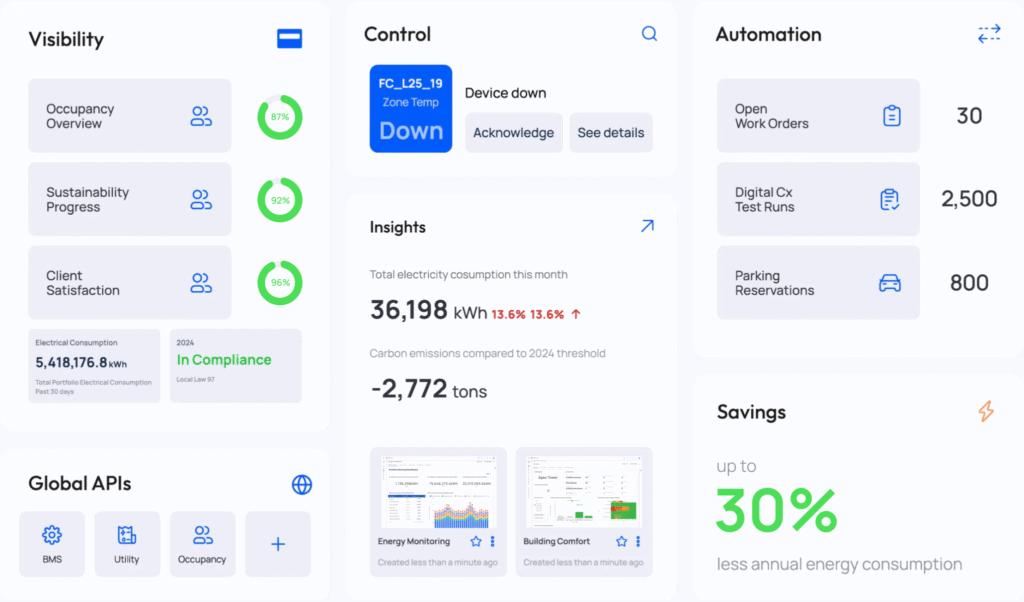
Here is what a single, standardized view of workspace utilization looks like in practice. In this edition of Inside the Dashboard, KODE walks through the Workspace Occupancy & Utilization dashboard. For example, you’ll see portfolio trends, building and floor patterns, and space-level behavior like dwell time, all from one trusted dataset.
Watch the full walkthrough: Workspace Utilization Across Portfolios, Buildings, and Spaces.
Once the underlying data is trustworthy, the hard decisions get easier to defend. Lease renewals, portfolio optimization, capital planning, hybrid workplace policy, headcount forecasting: all of them rest on one thing. Can you show, with evidence, how the space is actually used?
Without that evidence, every one of those decisions runs on competing assumptions. With it, they become strategic. Of course, the data doesn’t make the call for you. Still, it gives you something firmer than instinct when finance pushes back.
A common objection from occupiers: “We don’t own our buildings, so smart building platforms aren’t for us.” That thinking is a few years out of date.
Owners and occupiers solve different problems. Owners care about asset value, leasing performance, tenant retention, NOI, and building efficiency. Occupiers, by contrast, care about space effectiveness, employee experience, portfolio cost, and headcount planning. However, a modern workplace intelligence platform serves the occupier’s questions regardless of who holds the deed. It helps you understand utilization, improve the experience, defend lease decisions, and align facilities, workplace, IT, and real estate around the same numbers.
Ultimately, these are business decision platforms. The ownership model is beside the point.
For all the variations, occupiers keep circling the same handful of questions. How much space do we actually need? What will attendance look like a year from now? Can we support the headcount growth we’re forecasting? Which leases should we renew, and which locations should we redesign, consolidate, or expand? In the end, workplace utilization data is what turns each of those from a debate into a decision.
The organizations that get this right in 2026 won’t have the largest sensor deployments or the most elaborate dashboards. Instead, they’ll finally treat office space utilization data as a strategic input, not a quarterly report. It becomes the foundation underneath every major real estate decision, rather than an afterthought produced once the decision is already made.
Turn the workplace data you already have into one trusted view. Finally, see when, where, and why your space gets used. Book a KODE OS demo.
Office space utilization data is the combined record of how, when, and where workspace is actually used. The inputs come from access control, Wi-Fi, room booking, sensors, and workplace apps. Crucially, they’re standardized into one consistent view rather than several conflicting ones.
Usually not. Most occupiers already hold the inputs that matter. The work is consolidating existing systems into one trusted model, not buying more hardware.
An average hides the pattern. A building at 50% can be empty on Mondays and overcrowded on Wednesdays. The decisions that matter depend on day-of-week, building, and space-level detail, not one number.
No. Occupiers gain space effectiveness, employee experience, and defensible lease and headcount decisions regardless of who owns the building.
News, insights and resources from the world of smart building management.
By clicking "Sign Up" you're confirming that you agree with our Terms and Conditions.
What does Fault Detection & Diagnostics do? For building integrators, every truck roll has a cost. A technician sent out…
Read more

Smart building transformation doesn’t happen through technology alone. It requires teams that can coordinate across functions, solve complex challenges, and…
Read more

Walk the floor at any CRE technology conference this year, and the booths blur together. AI. Single pane of glass.…
Read more